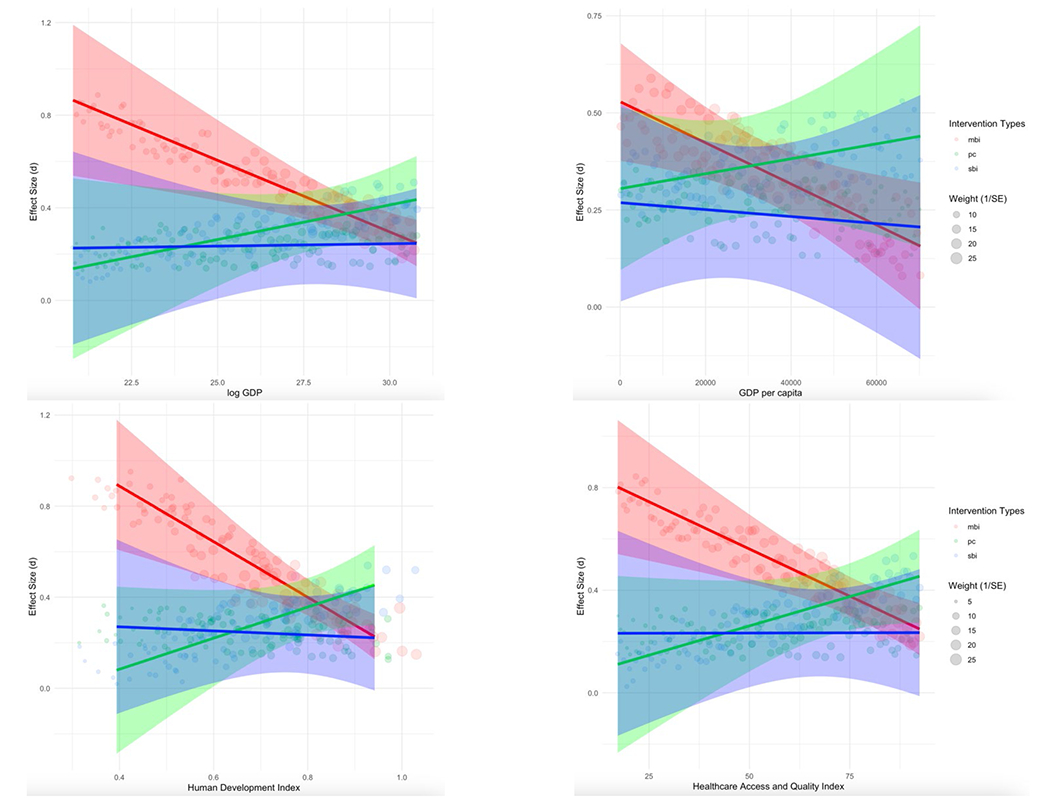
Figure 3.

Modeled Condition Impact
Note. Lines depict the interaction effects between intervention types and development indices, including log GDP (top left), GDP per capita (top right), HDI (bottom left), and HAQ (bottom right). They were computed from the meta-regression model clustered by report with small-sample corrections as reported in Table 4 using a sequence of 100 development indices (i.e., from min to max at an increment interval of max minus min divided by 100). The shading corresponds to 95% CI, while keeping the covariates of average age (28.79), percentages of females (43.65), expert facilitator (0.33), medical recruitment setting (0.49), culturally appropriate (0.23), and modified covariate for potential biases (0.23) at their grand means.
