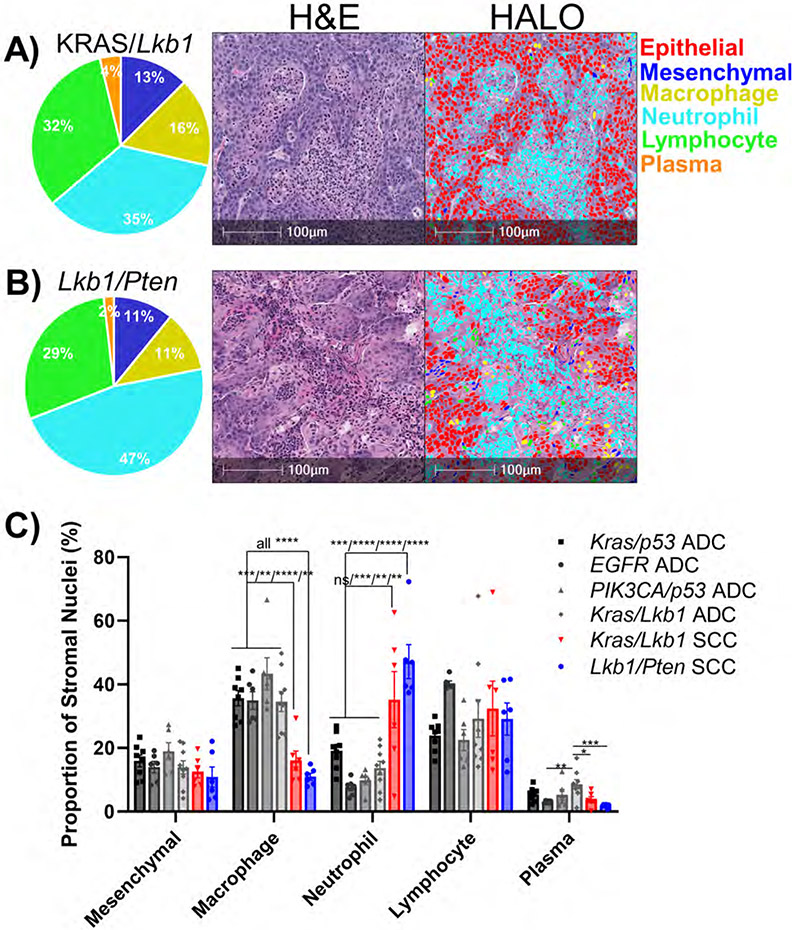
Figure 4: Neutrophil infiltration predominates in genetically-defined murine lung squamous cell carcinomas.
A+B) Representative H&E-stained sections with different cell types identified by the HALO® AI nuclear phenotyping algorithm. Pie charts represent percentages of non-epithelial cells. A) KRASG12D/Lkb1-null squamous cell carcinomas, n=6. B) Lkb1-null/Pten-null squamous cell carcinoma, n=6. C) Bar graph represents proportion of non-epithelial nuclei for the indicated genetic mouse models of NSCLC, plotted as mean +/− SEM. * indicates p<0.02, ** p<0.006, *** p<0.001, **** p<0.0001 by one-way ANOVA with multiple comparisons and Holm-Šídák's multiple comparisons test.

