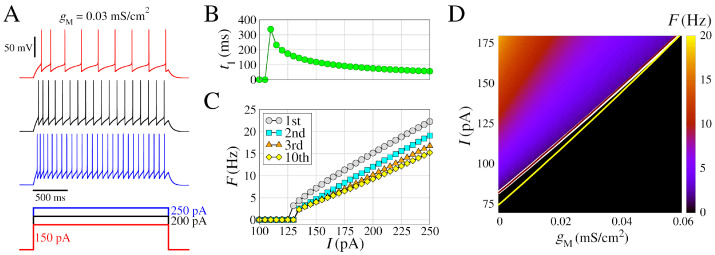
Figure 1.
Model of regular spiking neuron, with and for spike generation, and slow K+ current () for spike frequency adaptation. (A) (Top) Voltage traces with different amplitudes of the depolarizing pulses (bottom), mV before the depolarizing pulses. (B) Time to first spike () as a function of the injected current (amplitude of the pulse I). (C) Frequency–current curves (), where the instantaneous firing rate (inverse of the inter-spike interval) is represented as a function of I. The curves indicated by different colors correspond to the 1st, the 2nd, the 3rd, and the 10th spikes in the train. (D) Spike frequency F (in color) as function of and I, considering 5.0 s time window. The white line represents the transition where for = 0 and = 0. Additionally, this transition lines for = 0 and = 0.1 mS/cm2 (brown line), and = 0.4 mS/cm2 and = 0 (yellow line) are shown. Other parameters are m, mS/cm2, = −85.0 mV, = 50 mS/cm2, mV, mS/cm2, = 1000 ms, and = 0.03 mS/cm2. The absolute values of the membrane potential of (A) are available at https://github.com/FernandoSBorges/BistabilityHH (accessed on 1 September 2023).

