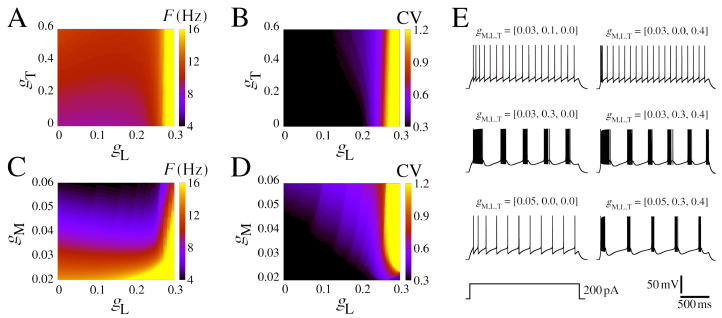
Figure 2.
Firing pattern for different , , and conductances. (A) Firing rate in colored ()-diagram for mS/cm2. (B) The same as (A) for the CV. (C) Firing rate in colored ()-diagram for mS/cm2. (D) The same as (C) for the CV. (E) Exemplar voltage traces considering different values of , , and , where each parameter combination is shown atop and mV before the depolarizing pulses. Other parameters are the same as Figure 1 with I = 200 pA.

