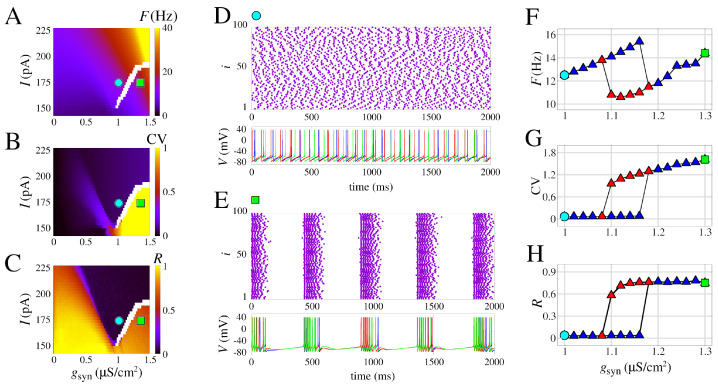
Figure 4.
Burst synchronization in space parameters as a function of I and chemical synaptic conductance (). (A) Mean firing frequency. (B) Coefficient of variation. (C) Mean order parameter. (D,E) Raster plot and the neuronal membrane potentials for the parameter indicated in (A–C). (D) Desynchronized spikes for the parameters I = 170.4 pA and = 1 S/cm2 are observed and synchronized bursts are shown for the parameters I = 170.4 pA and = 1.3 S/cm2 in (E). (F–H) Curves of F, CV, and R, respectively, for increasing values of (blue triangles) and decreasing values of (red triangles). We use the model with slow potassium and without calcium currents, i.e., mS/cm2.

