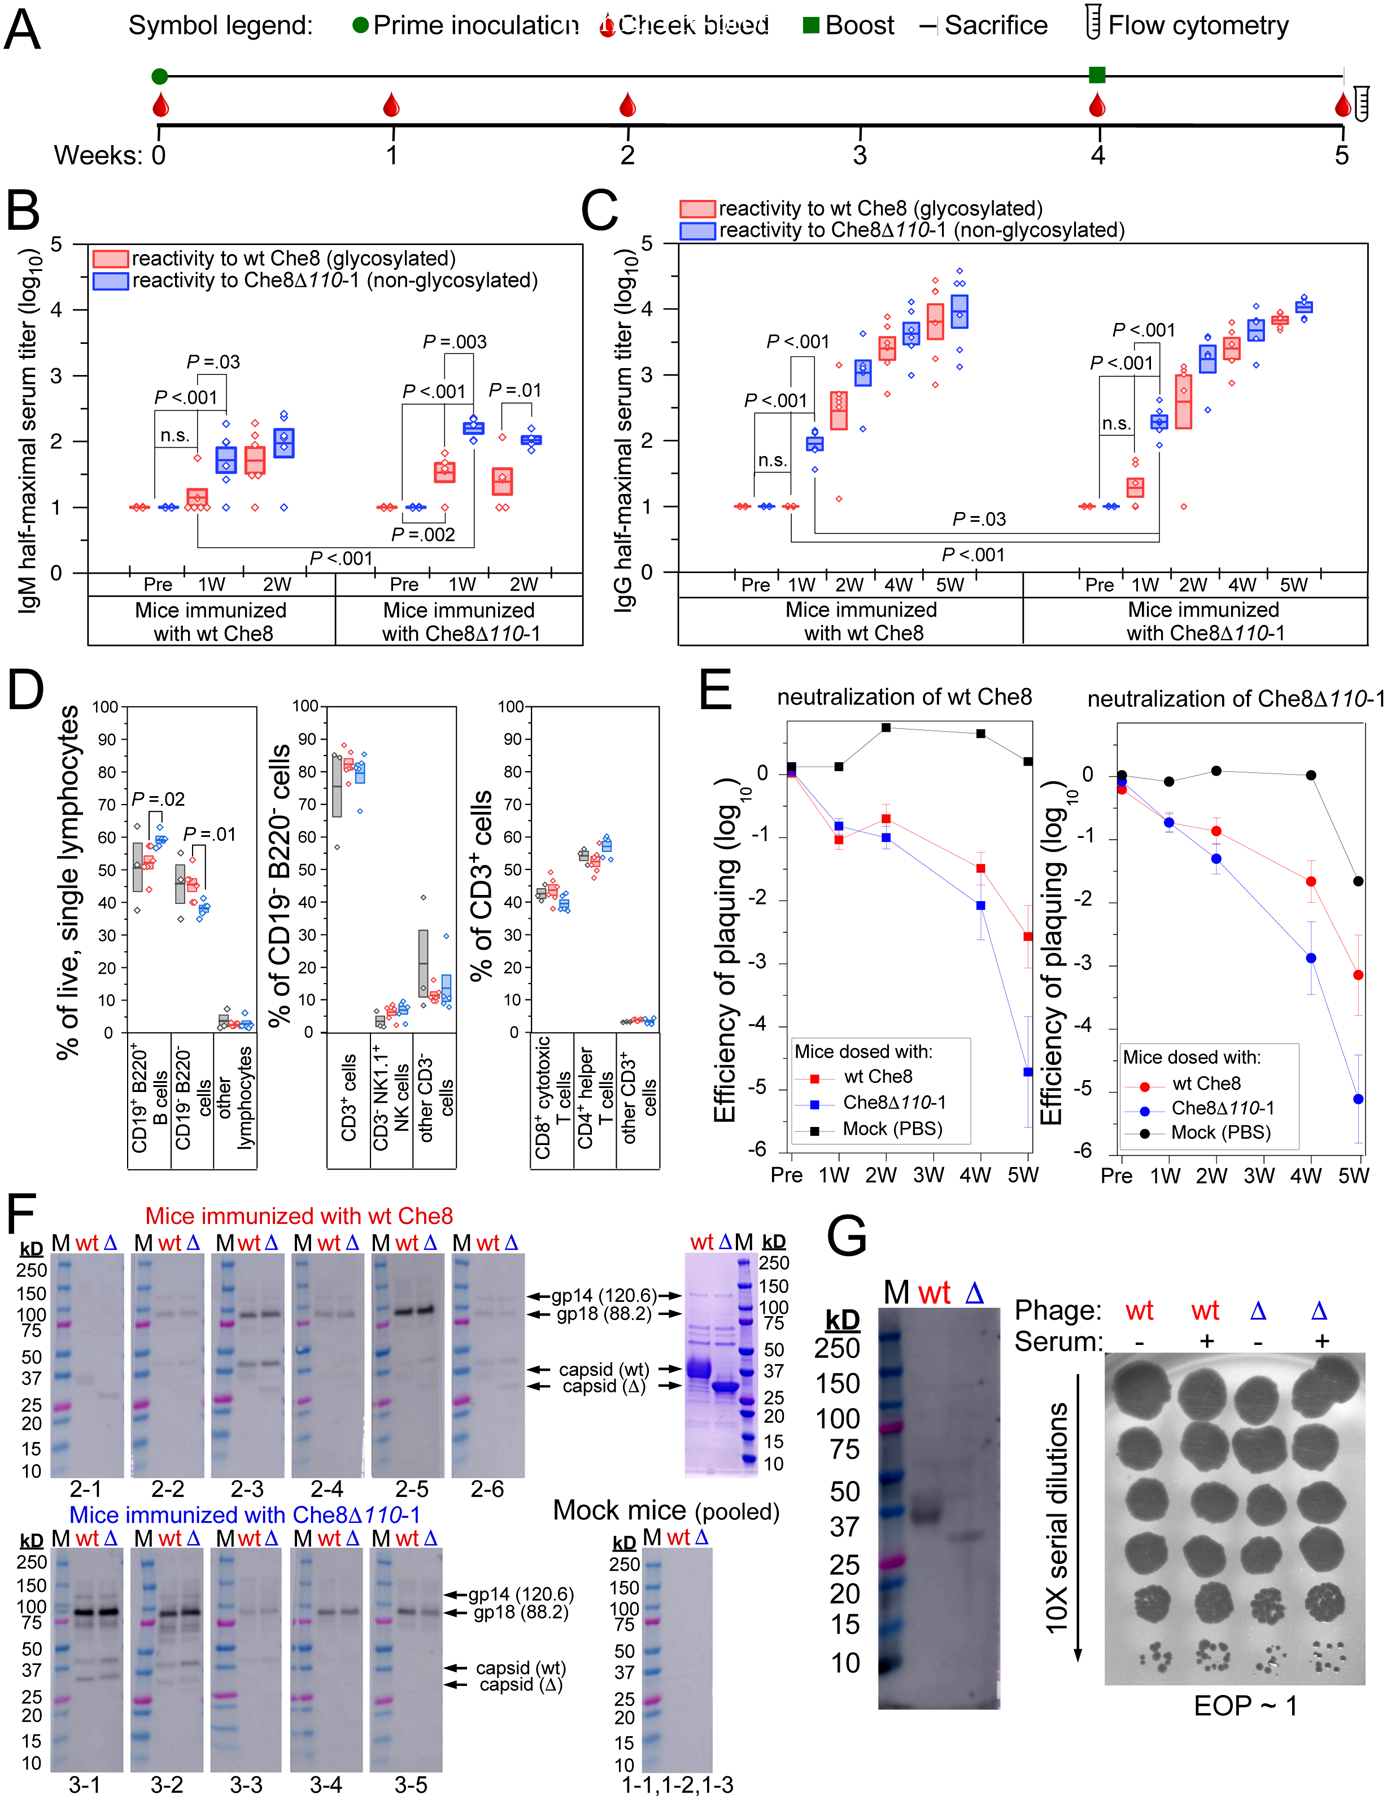
Figure 4. Glycosylation shields wild-type Che8 from antibody recognition.

A. Timeline of the C57BL/6J mouse study. Mice were inoculated with PBS, wt Che8, or Che8 Δ110-1 (Table S3) and serum collected via submandibular bleed as indicated. A second dose was administered at four weeks, after serum collection, and at five weeks mice were sacrificed and terminal sera and spleens were harvested. B and C. ELISA were used to quantify IgM (B) and IgG (C) titers in sera from mice inoculated with wild type Che8 (left panels) and Che8Δ110-1 (right panels) at the indicated timepoints. Box plots show half-maximal titers for individual mice with a line showing mean values and the boxes representing the mean value +/− 1 standard error. Two sample t-tests were performed between relevant pairs and P values are shown where differences are significant. Antibody recognition of wild type Che8 and the Che8Δ110-1 mutant are shown in red and blue, respectively. D. Multicolor flow cytometry was gated as shown in Figure S4. Shown are proportions of CD19− B220− vs CD19+ B220+ B cells in the live, single lymphocyte population; of CD3+ vs CD3− cells in the CD19− B220− population; and of CD4+ and CD8+ T cell subtypes in the CD3+ population. E. Phage neutralization by serum was determined by incubating phages with sera and measuring reductions in phage titers from the starting input (109 pfu/ml). Each panel presents the average +/− standard error neutralization of Che8 (left) and Che8Δ110-1 (right) by sera from mock–, Che8– or Che8Δ110-1–inoculated mice shown in black, red, and blue, respectively. F. Western blots showing IgG reactivity to virion proteins of Che8 (wt) and Che8Δ110-1 (Δ) in sera collected from individual mice (as shown below each blot) five weeks after inoculation; molecular weight makers, M. Upper and lower panels use sera from Che8-inoculated and Che8Δ-inoculated mice, respectively. Serum from mock-inoculated mice were pooled. Panel at the upper right shows Coomassie stained proteins used in the Western blots. Putative protein identities are indicated. G. Western blot (left) using normal human serum showing some reactivity to virion proteins (left panel), but no phage neutralization (right panel).
