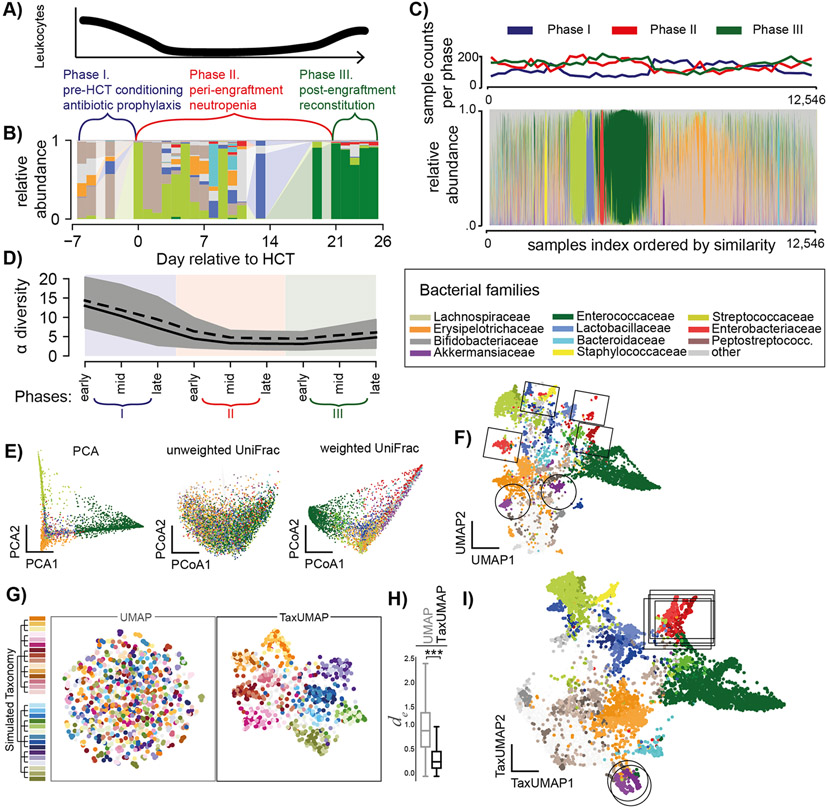
Figure 1. The TaxUMAP algorithm effectively visualizes different microbiome states.
A) Three distinct clinical phases of a HCT therapy. B) Gut microbiome bacterial compositions over time from one patient; bars represent the relative taxon abundances measured in a stool sample by 16S rRNA gene sequencing. C) Compositions in 12,546 samples; clinical phases at collection indicated. D) Bacterial α-diversity (inverse Simpson index) over pseudo-time by assigning each sample to an early, mid, or late phase of the respective clinical phase (shading as per colors in A) during which a sample was obtained; mean (black solid) and median (black dashed) diversity (n=12,546, shaded: 95%C.I. of the mean). E) ASV level principal component, and principal coordinate plots of all samples (unweighted- and weighted UniFrac distances). F) UMAP embedding at the ASV level. G) Comparison between UMAP and TaxUMAP on a simulated data set; colors indicate the hypothetical genus, indicated on the simulated taxonomy tree, with the highest abundance in a sample. H) Euclidean distances between in silico generated samples with the same dominant family in UMAP vs. TaxUMAP embedding (n=1,000, ***:p<10−4, Wilcoxon rank sum test). I) TaxUMAP embedding of patient samples. E, F, I) color by most abundant taxon.

