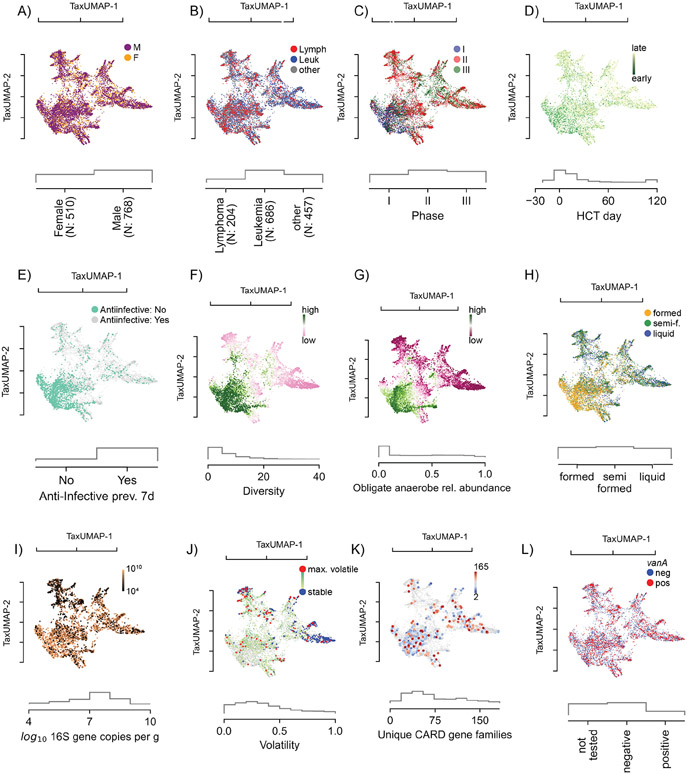
Figure 2. The atlas of the HCT bacterial gut microbiota using TaxUMAP.
Each scatter plot is accompanied by histograms (grey) of the displayed metadata distribution. A) Samples from female and male donors, with B) different diseases. C) Samples from different clinical phases; phase I samples are concentrated in a distinct region corresponding to D) samples taken early during therapy. In the same region, samples are concentrated where no anti-infective administrations were recorded in the 7 days prior to sample collection (E). F) Bacterial α-diversity (measured by the inverse Simpson index). G) Relative abundances of obligate anaerobe commensal taxa. See also Figure S1A. H) Stool composition (liquid, semi-formed, formed stool). I) Total bacterial abundance estimated by total 16S gene copy numbers per gram of stool. See also Figure S1B-C. J) Volatility of the bacterial community (most volatile in red: volatility >0.9; least volatile in blue: volatility<0.1). See also Figure S1D-G. K) Unique antimicrobial resistance phenotypes detected per sample. See also Figure S1H-K. L) Vancomycin-resistance conveying vanA gene detected in rectal swab. See also Figure S1K-M.

