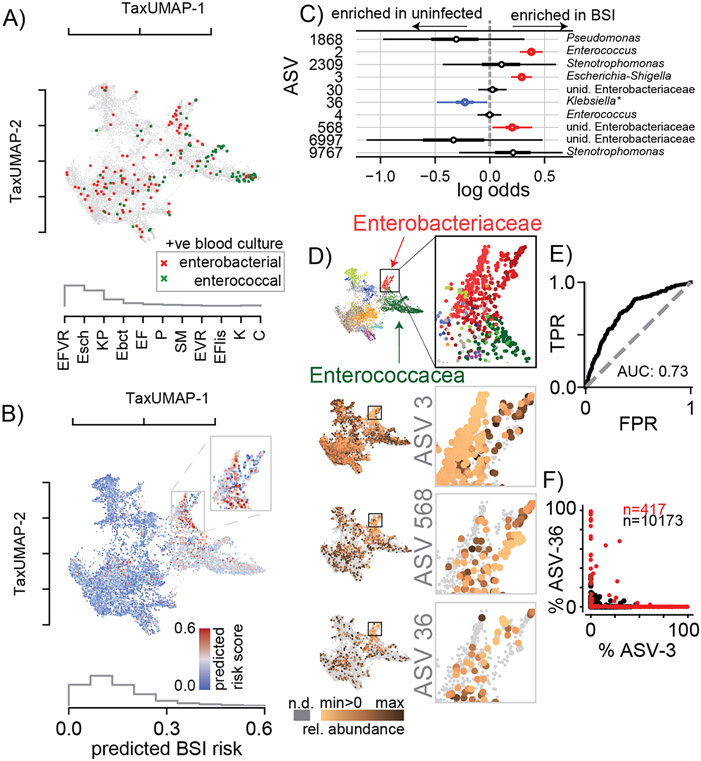
Figure 3. BSI risk scores across the TaxUMAP suggests reduced risk-associated ASV-36-Klebsiella may exclude high risk-associated Escherichia.
A) TaxUMAP visualization of samples followed by a BSI within the next week, no infection (grey), BSI by gamma proteobacteria (dark red), or enterococcal species (green); histogram shows relative frequencies of blood isolate taxa. B) TaxUMAP of the mean a posteriori predicted BSI risk per sample from a Bayesian logistic regression comparing stool compositions between BSI cases and uninfected patients using the log10-relative ASV abundances of 10 predictor ASVs, the histogram shows the distribution of posterior risk predictions across all samples; inset: magnified region with the highest predicted risk samples. C) Posterior coefficient distributions (circle: mean, box: HDI50, whiskers HDI95). D) High risk samples are located in the Enterobacteriaceae dominated TaxUMAP region (top: TaxUMAP with samples labeled by the most prevalent taxon as in Figure 1I); ASV-3 and ASV-568 (increased risk) and ASV-36 (reduced risk) relative abundances across the TaxUMAP and in the magnified Enterobacteriaceae dominated region. E) Receiver-operator characteristic of the Bayesian model. F) Relative abundances of ASV-3 and ASV-36 across all samples where Enterobacteriaceae represented the most abundant family (red), or not (black). Blood isolate organism abbreviations) EFVR: E. faecium vancomycin resistant, Esch: Escherichia, KP: K. pneumoniae, Ebct: Enterobacter, EF: E. faecium, P: Pseudomonas, SM: Stenotrophomonas maltophilia, EVR: Enterococcus vancomycin resistant, EFlis: E. faecalis, K: Klebsiella, C: Citrobacter; abbreviations in ROC, E) TPR: true positive rate, FPR: false positive rate.

