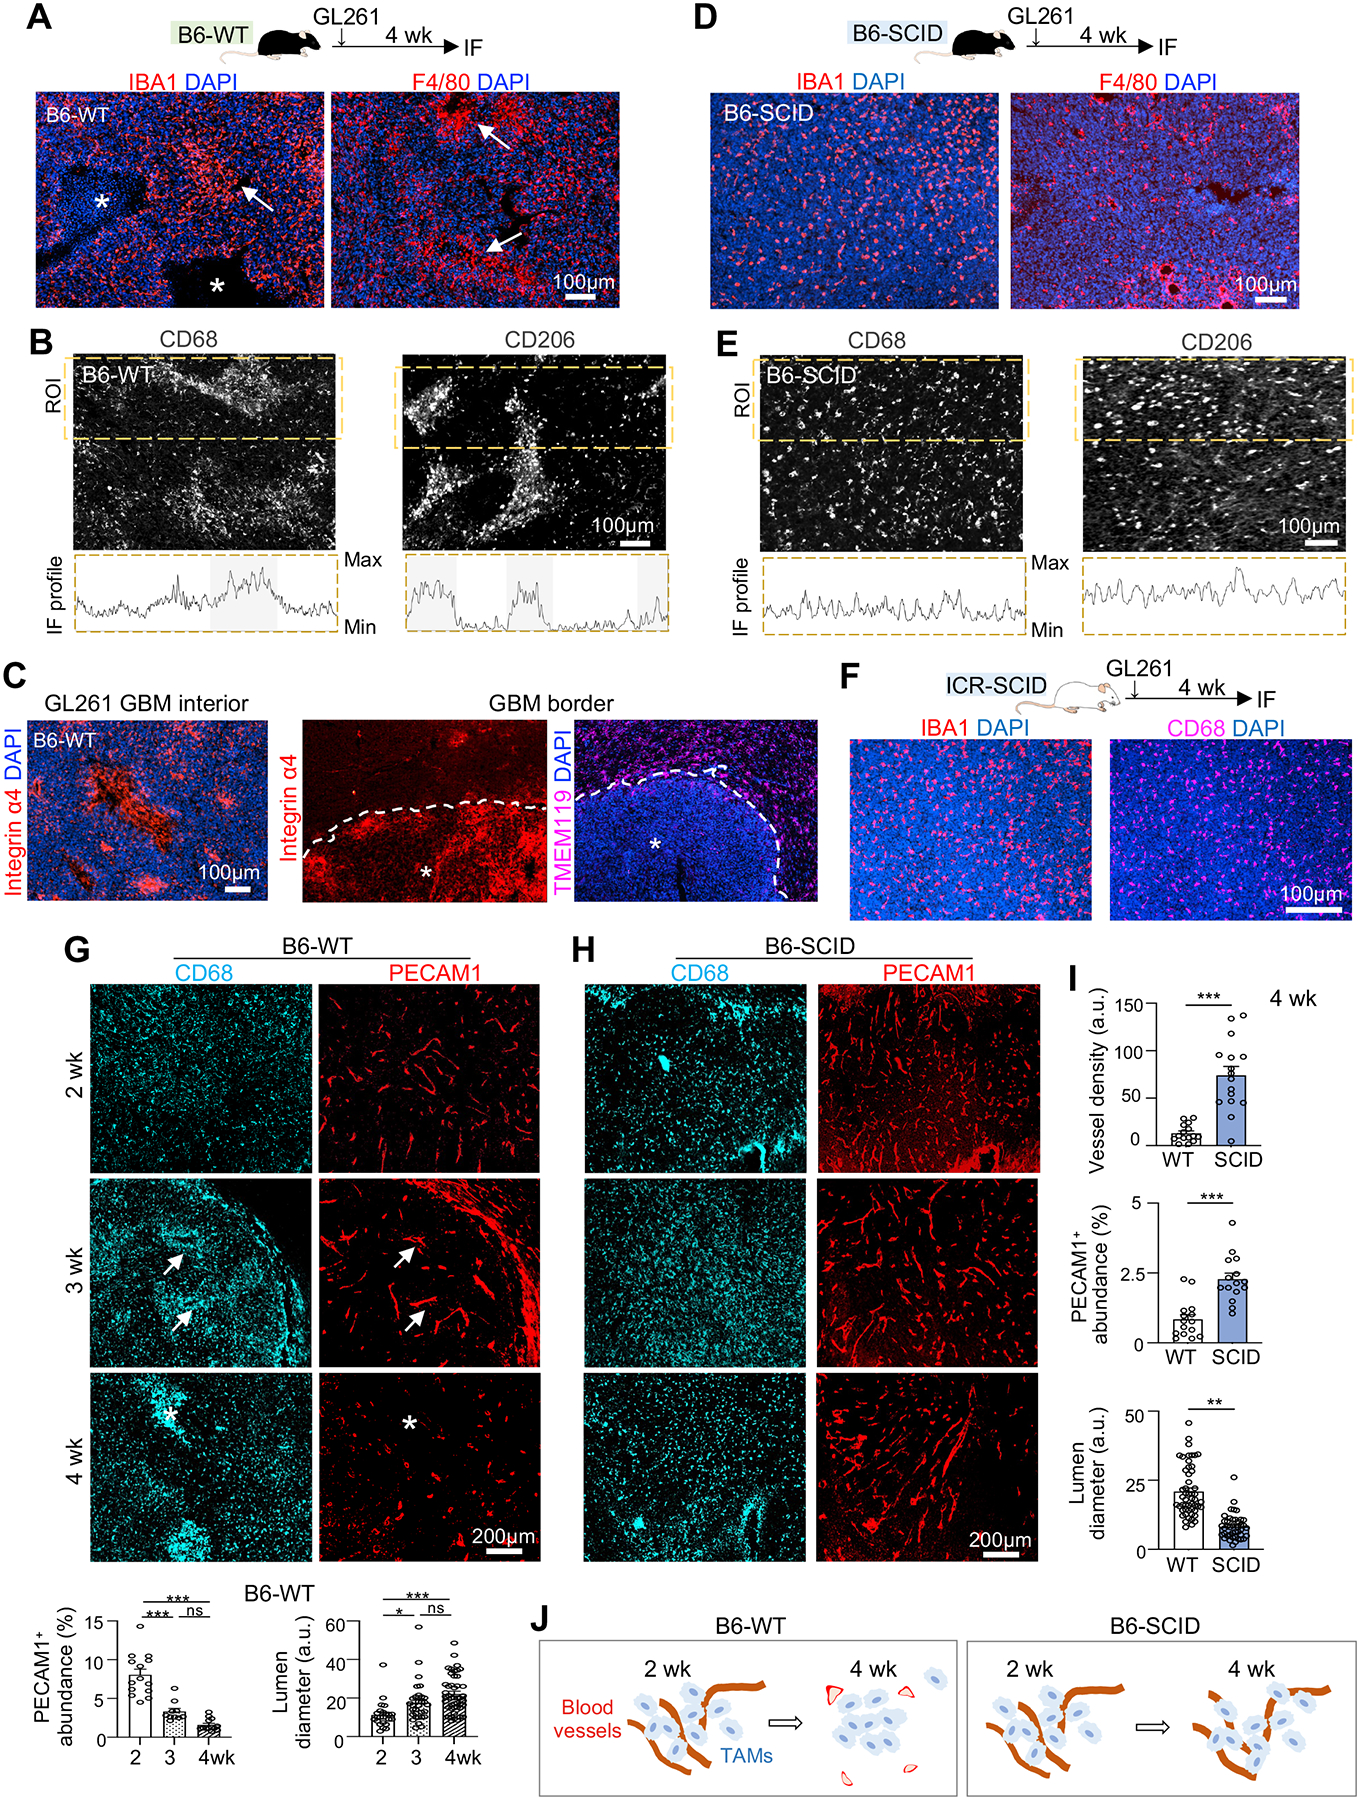
Figure 1. Temporospatial patterning of TAMs parallels vascular changes during GBM progression and is influenced by host immunocompetence status.

(A) Top, experimental scheme of intracranial transplant of GL261 GBM cells into C57BL/6 wild-type (B6-WT) hosts and IF analysis 4 weeks later. Bottom, representative IF images from n=3 mice show spatial patterning of IBA1+ and F4/80+ TAMs. Asterisks, necrotic cores; arrows, TAM aggregates.
(B) IF images and profile plots of IF intensities of CD68 or CD206 within region of interest (ROI, dashed boxes).
(C) IF images of MDM (integrin α4+) or microglia (TMEM119+) in GBM interior (asterisks) or GBM border (dashed line) at 4 weeks post-transplant in B6-WT host.
(D) Top, experimental scheme of GL261 transplanted into C57BL/6-SCID (B6-SCID) hosts and IF analysis 4 weeks later. Bottom, representative IF images from n=3 mice show distribution of TAMs (IBA1+ or F4/80+).
(E) IF images and profile plots of IF intensities of CD68+ and CD206+ TAMs within ROI in B6-SCID host.
(F) Representative IF images show distribution of IBA1+ and CD68+ TAMs in GL261 established in ICR-SCID host (n=3 mice).
(G-I) IF images and quantifications of vascular changes and temporospatial transition of CD68+ TAMs in distinct zones of GL261 GBM established in B6-WT host (G) or B6-SCID host (H). Quantifications in bottom of (G): PECAM1 abundance, n=10 tumor areas; lumen diameter, n=30 tumor areas, from n=3 mice per timepoint. One-way ANOVA; a.u., arbitrary units. Quantification of vascular comparison (I): n=15 randomly chosen tumor areas from n=5 mice per group; unpaired t-test. *P<0.05; **P<0.01; ***P<0.001; ns, not significant.
(J) Diagrams depicting TAM spatial patterning in parallel to vascular changes in dependence of host immune status.
