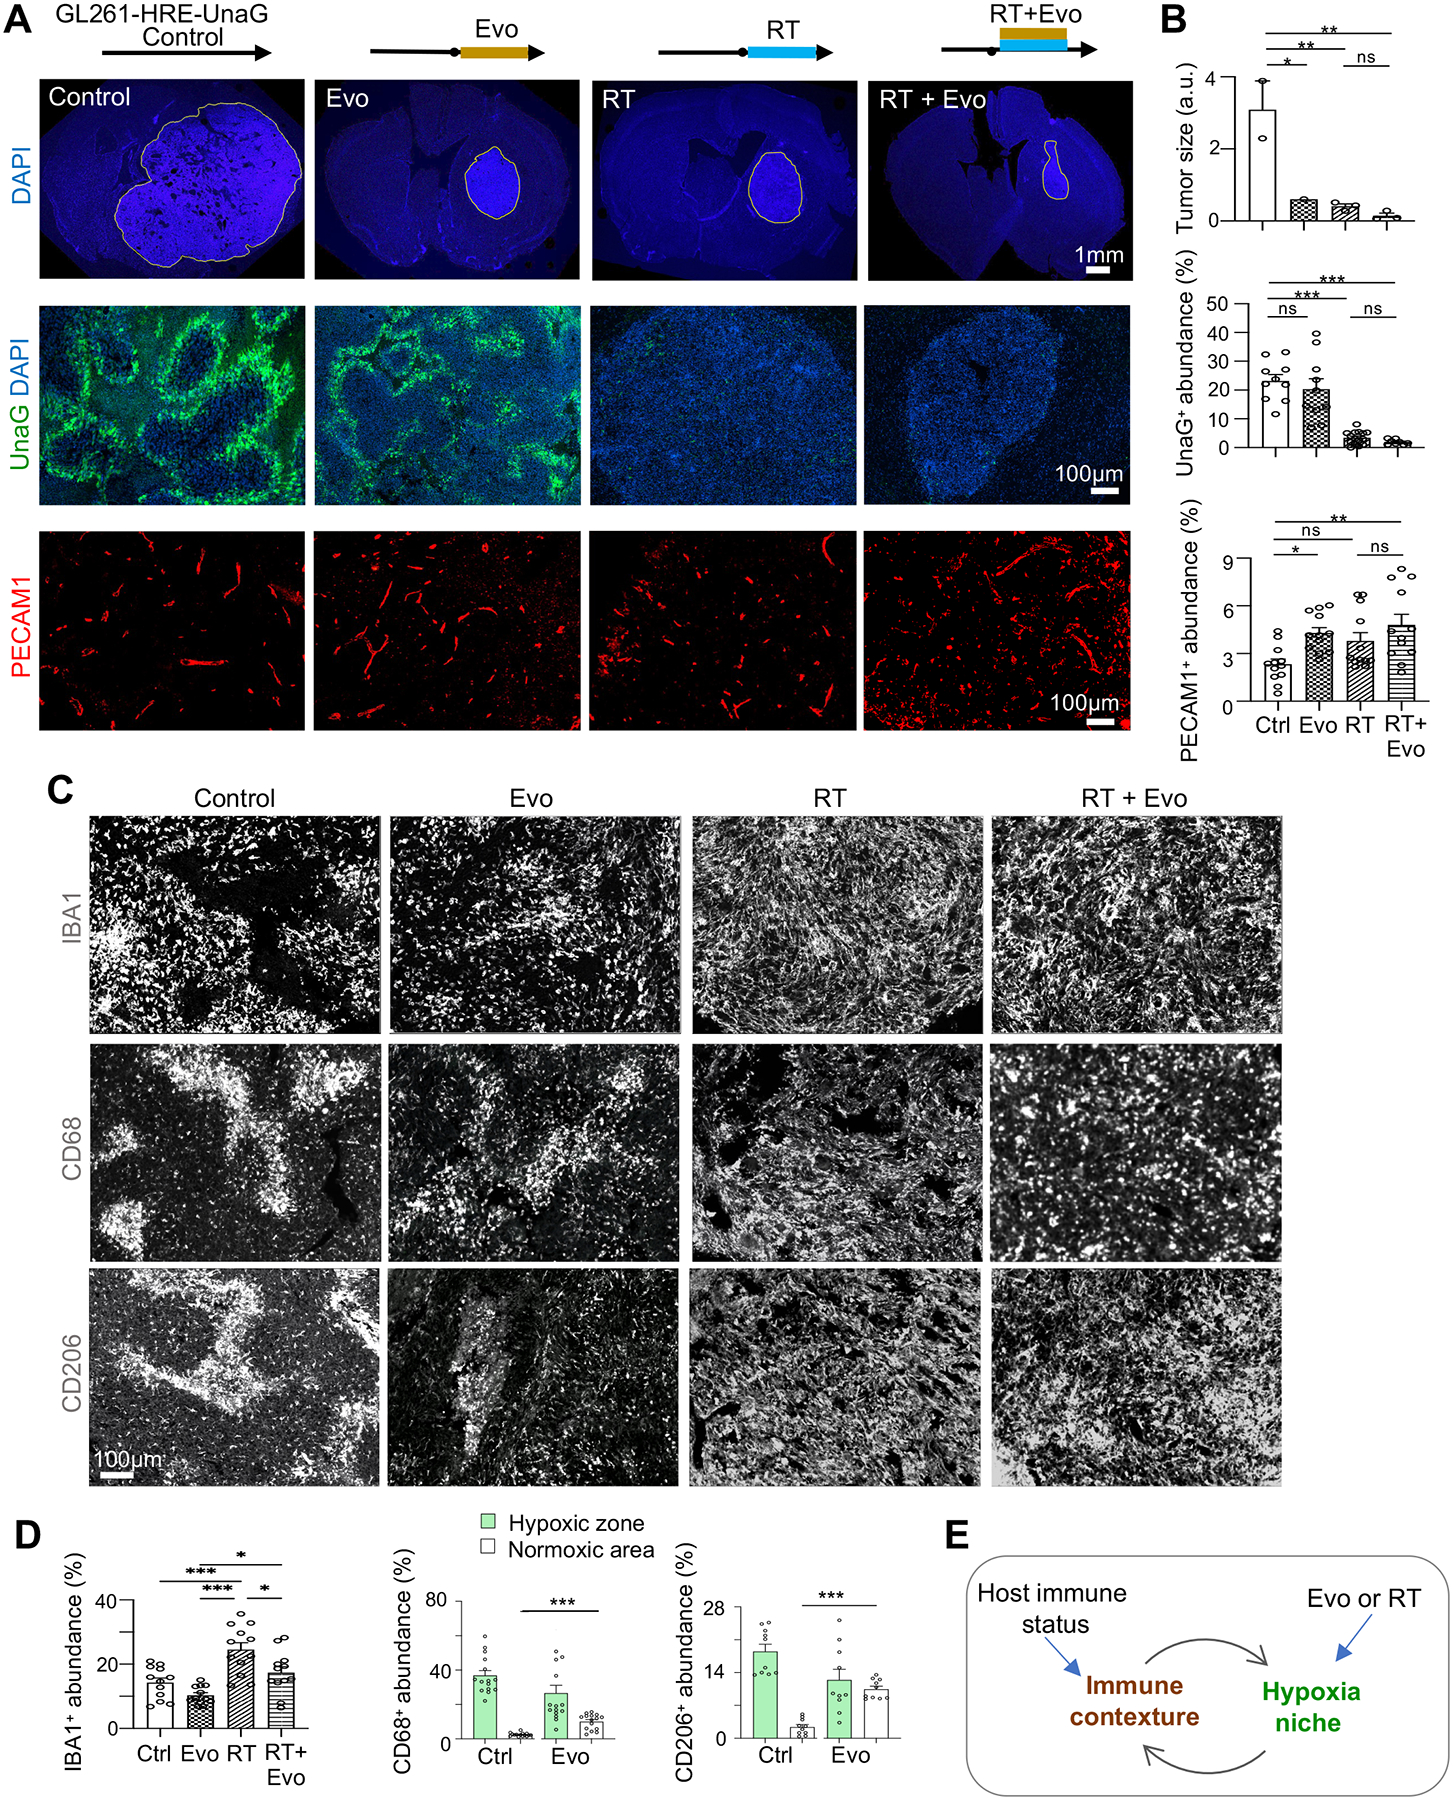
Figure 4. Targeting hypoxic niches disrupts spatial patterning of TAMs.

(A, B) Two weeks after transplantation, B6-WT mice bearing GL261 GBM were treated for 2 weeks with evofosfamide (Evo), radiation treatment (RT), or both. IF images (A) and quantifications (B) show tumor area, hypoxic zones (UnaG+), and tumor vasculature (PECAM1+) after treatment. n=3 mice for tumor size; n=10 for UnaG, and n=12 for PECAM1 abundance in randomly selected tumor areas from 3 mice per cohort.
(C, D) IF images (C) and quantifications (D) show abundance and distribution of TAMs expressing IBA1, CD68, or CD206 after treatments. n=10–15 randomly selected images from 3 mice per treatment condition.
(E) Diagram depicting interaction of immune response and tumor hypoxia.
One-way ANOVA (B, D); *P<0.05, **P<0.01, ***P<0.001, ns, not significant.
