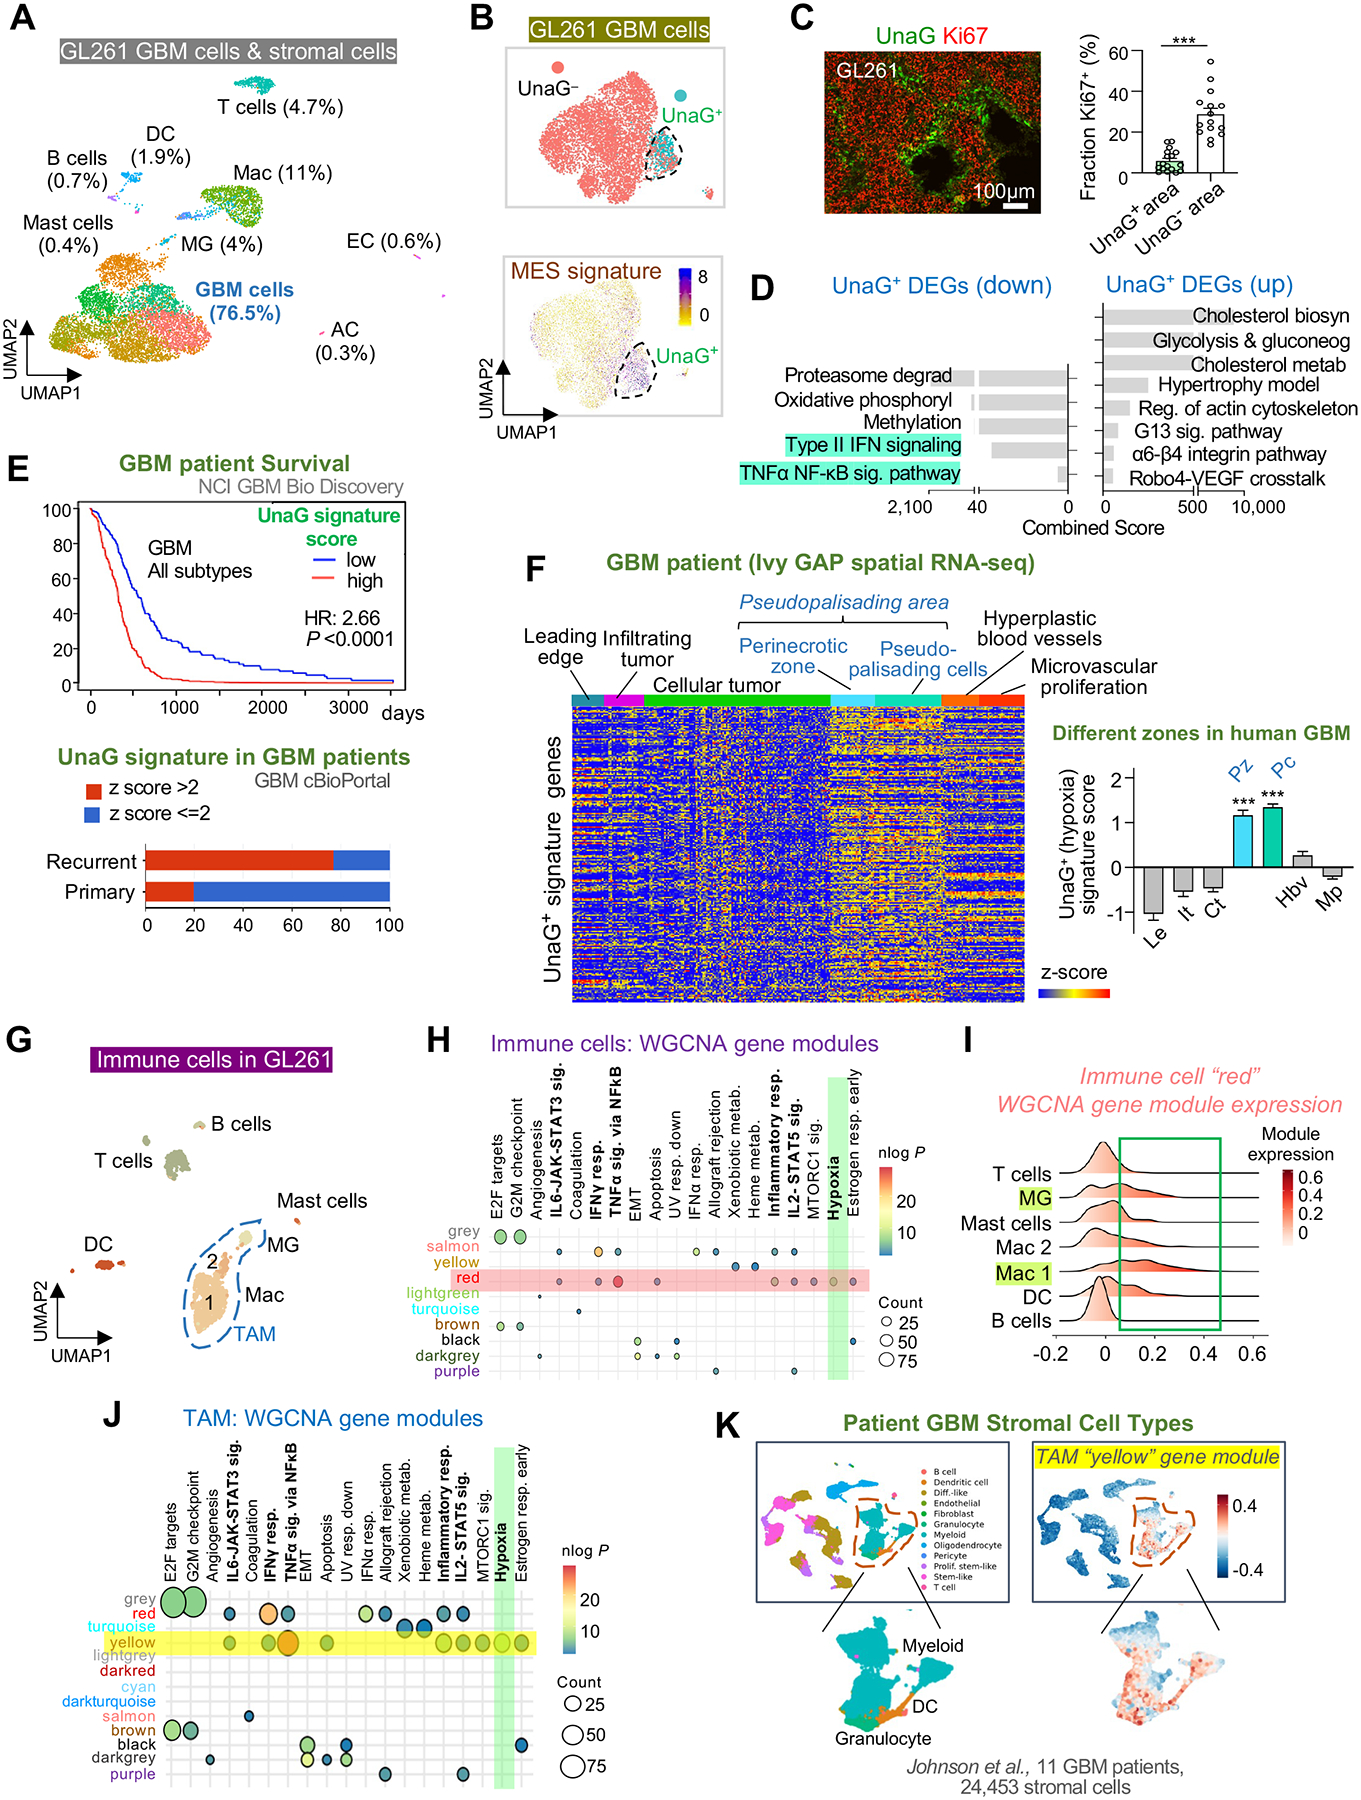
Figure 5. Single cell RNA-seq reveals distinct in vivo GBM hypoxia gene signature and the presence of a hypoxic subpopulation of immune cells.

(A) UMAP plot of cell types identified by scRNA-seq of GL261 tumor in B6-WT host at 4 weeks post-transplant.
(B) UMAP plot of GL261 GBM cells shows UnaG+ and UnaG− cell clusters and expression scores for MES2 gene signature (Neftel et al., 2019).
(C) IF image and quantification show fraction of Ki67+ cells in UnaG+ and UnaG− areas. n=15 tumor areas from 3 mice per group; unpaired t-test; ***P<0.001.
(D) ENRICHR pathway enrichment analysis of up- and downregulated DEGs in UnaG+ vs. UnaG− GBM cells (WikiPathways 2019 gene sets).
(E) Top, survival curve of human GBM patients stratified into high or low expressors of UnaG+ GBM gene signature based on TCGA GBM database (NCI BioDiscovery portal). Bottom, representation of UnaG+ gene signature in primary vs. recurrent human GBM (cBioPortal).
(F) Heatmap and bar graph show relative enrichment of UnaG+ gene signature in different zones of human GBM based on Ivy GBM Atlas Project (Ivy GAP) database. One-way ANOVA; ***P<0.001.
(G) UMAP of immune cells in GL261 GBM.
(H) Transcriptome of immune cells analyzed by weighted gene correlated network analysis (WGCNA). Co-expressed gene modules (rows with color names) were assessed for enrichment of hallmark gene sets (columns). Highlighted row and column denote enrichment of module “red” for “Hypoxia” gene set (green).
(I) Expression scores for WGCNA gene module “red” in different immune cells of GL261 GBM.
(J) Transcriptome of TAMs analyzed by WGCNA. Selected co-expressed gene modules (rows) were assessed for enrichment of hallmark gene sets (columns). Highlighted row and column denote enrichment of gene module “yellow” for “Hypoxia” gene set (green).
(K) Mapping of hypoxic TAM gene module “yellow” onto human GBM patient scRNA-seq dataset (Johnson et al., 2021) shows enrichment scores in myeloid cells, as well as granulocytes and dendritic cells (DC).
See also Figures S2–S4.
