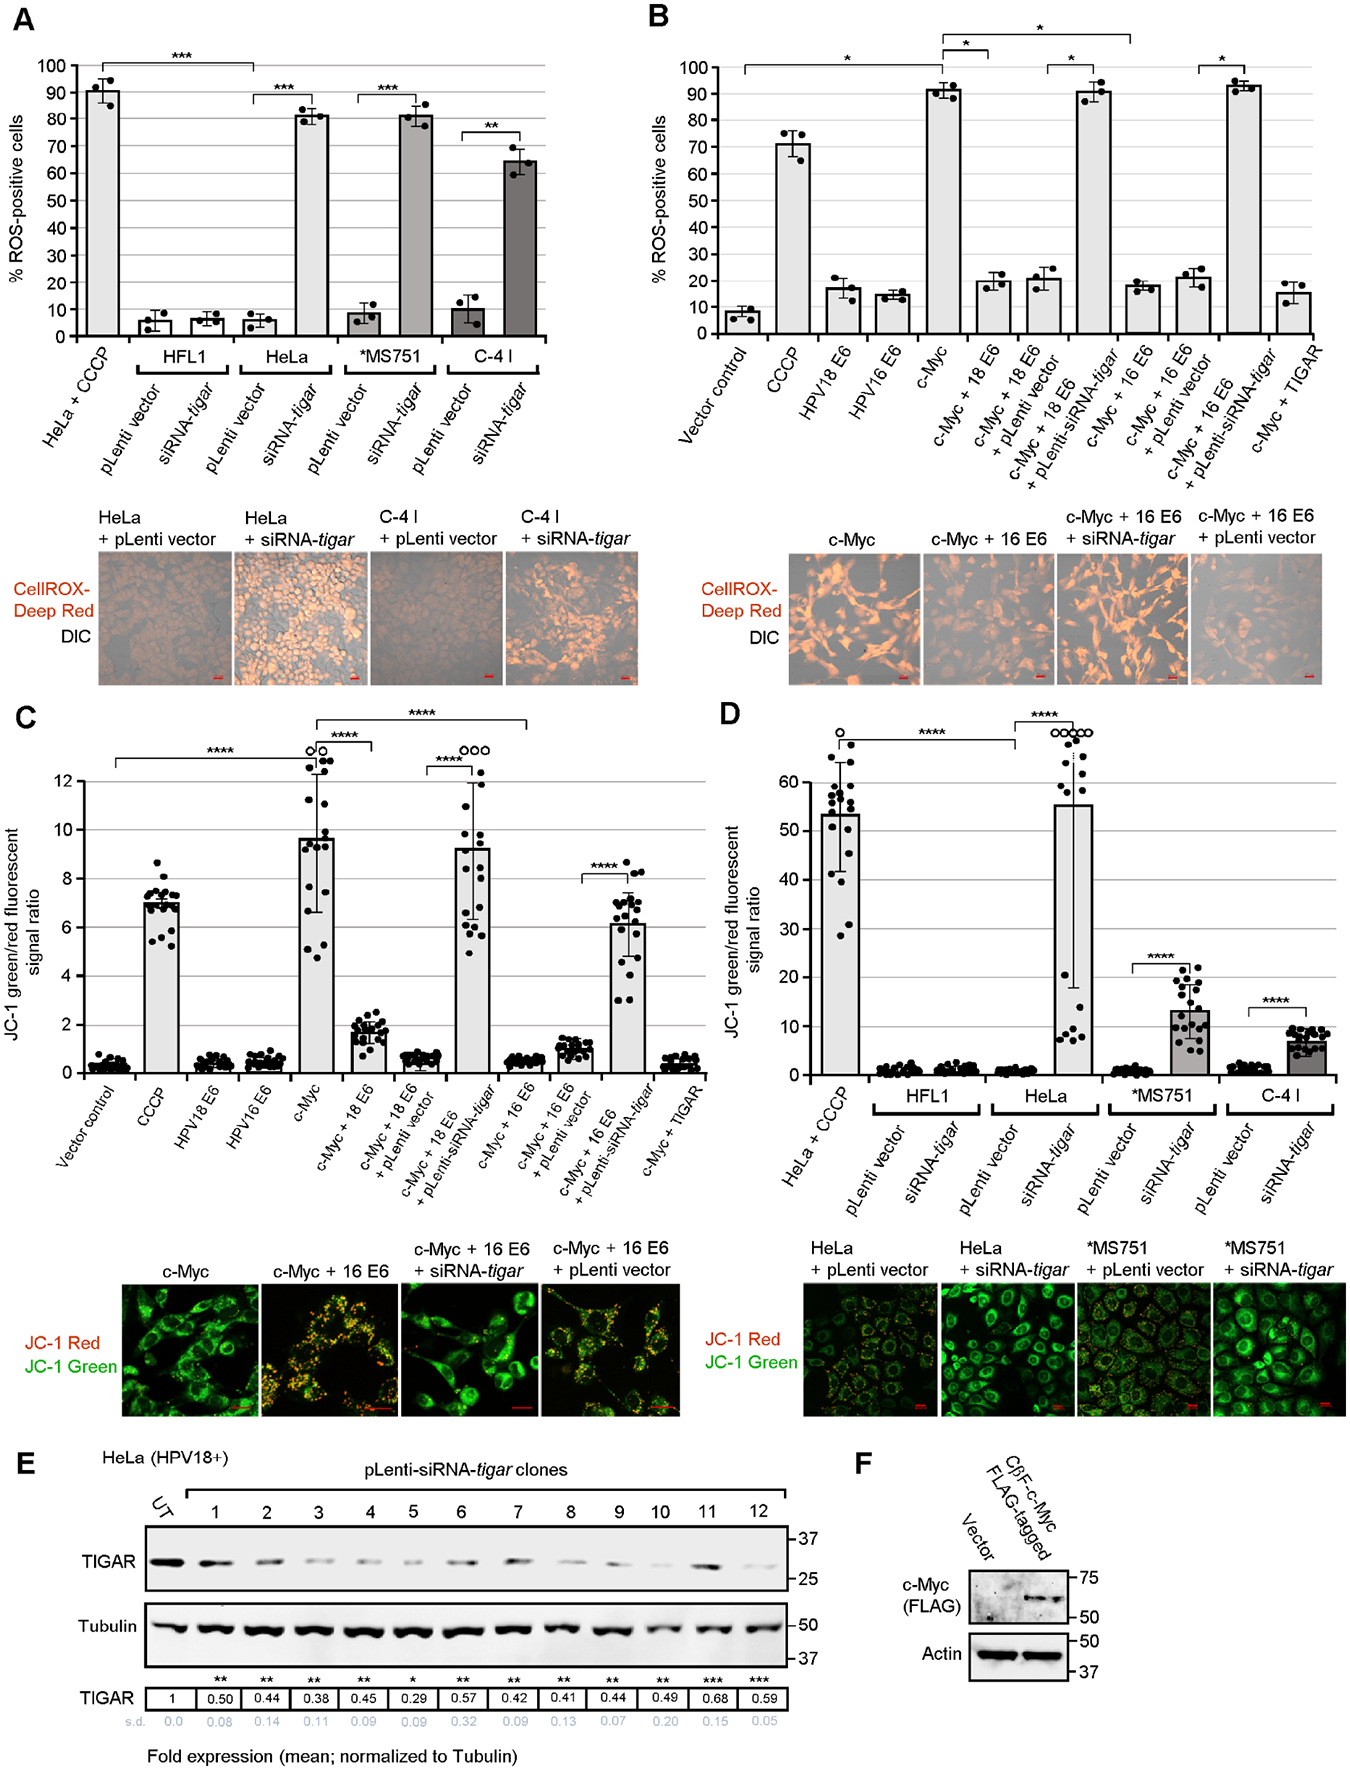
Fig. 3.

The hrHPV E6 oncoproteins cooperate with c-Myc and inhibit oncogene-induced oxidative stress and mitochondrial membrane depolarization in HPV-transformed cervical carcinoma cells through the activation of TIGAR. (A) To determine the effects of inhibiting TIGAR upon the accumulation of damaging ROS, the HPV18+ cell-lines, HeLa, MS751, and C-4 I were transduced with a lentiviral siRNA-tigar expression vector to knockdown endogenous TIGAR protein levels or an empty lentiviral vector (pLenti) as negative control. The transduced cells were labeled with a fluorescent ROS chemical probe, CellROX-Deep Red (Invitrogen), and the relative percentages of ROS-positive cells were quantified by confocal microscopy. HeLa cells treated with the chemical uncoupler CCCP (50 μM; Millipore-Sigma) were included as a positive control. Human HFL1 fibroblasts (HPV-negative) are shown for comparison. Representative micrographs are provided in the lower panels. (B) The ability of hrHPV E6 oncoproteins to cooperate with c-Myc and prevent the accumulation of oncogene-induced ROS was assessed by cotransfecting HT-1080 cells with a CβF-c-Myc (FLAG-tagged) construct and either an HPV16/18 E6 expression plasmid or empty CβS vector as negative control. To determine if the protective effects of E6 were dependent upon TIGAR’s antioxidant functions, certain samples were transduced with an empty pLenti vector or lentiviral-siRNA-tigar to inhibit TIGAR expression. (C and D) The effects of the viral E6 oncoprotein and TIGAR functions upon c-Myc-induced mitochondrial membrane depolarization were determined by transducing HT-1080 cells, cotransfected with expression constructs for c-Myc and/or the HPV16/18 E6 oncoproteins (in C), or the HPV18+ cell-lines: HeLa, MS751, and C-4 I (in D), with lentiviral-siRNA-tigar or an empty pLenti vector as negative control. The samples were then stained with the fluorescent chemical probe JC-1 (Invitrogen) and confocal microscopy was performed to quantify the ratios of the relative fluorescence intensities for the JC-1 red (indicative of polarized mitochondrial membranes) and green (which indicates depolarization) signals using Carl Zeiss Microscopy ZEN OS imaging software. The open circles indicate data out-of-range. Graphed data in A-D is mean ± SD. Representative micrographs are shown in the lower panels. Scale bar, 20 Pm. (E) HPV18-transformed HeLa cells were transduced with various lentiviral-siRNA-tigar clones and the effective knockdown of TIGAR protein expression was assessed by immunoblotting and densitometry quantitation relative to Tubulin levels. UT, untransduced cells. (F) The FLAG-tagged c-Myc oncoprotein was also detected in transfected cells by immunoblotting. N-value = 3. The asterisks denote statistical significance as determined using unpaired two-tailed Student’s t-tests (*P<0.0332, **P<0.0021, ***P<0.0002, ****P<0.0001).
