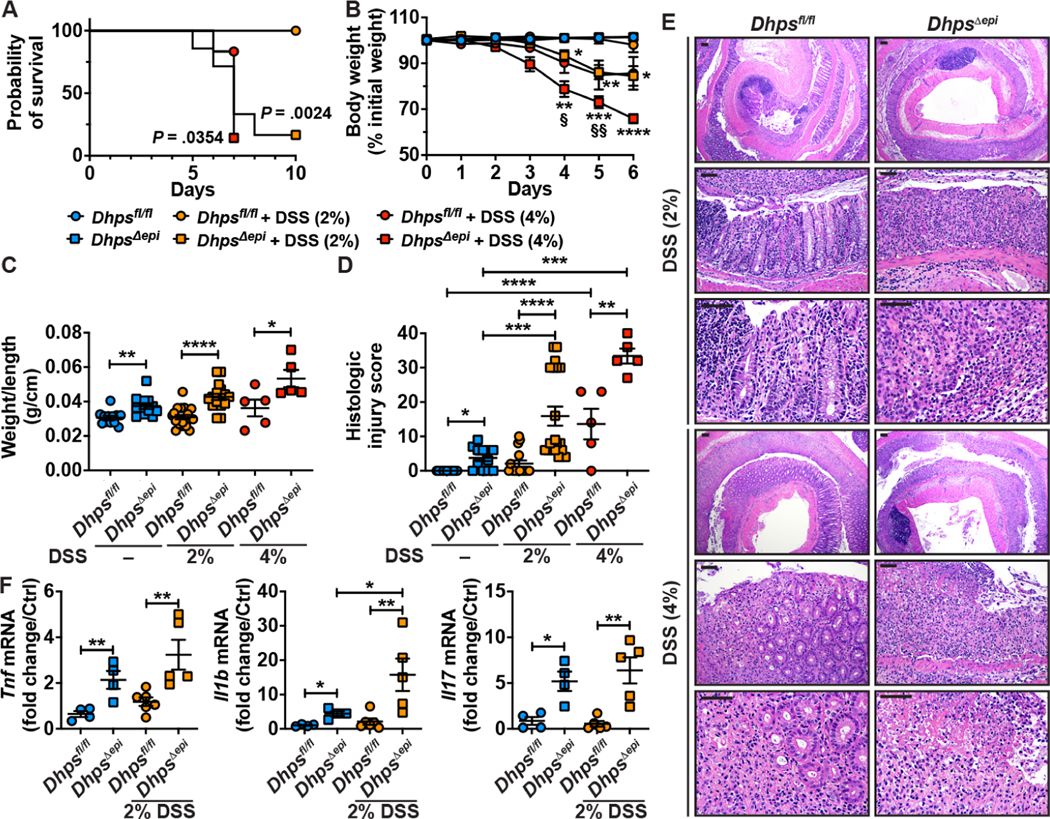
Figure 3.
DSS-induced colitis in Dhpsfl/fl and DhpsΔepi mice. Animals were treated or not with 2% or 4% DSS. (A) Kaplan-Meier curves of DSS-treated mice; the P value was obtained using the Log-rank test (n = 7–20 mice/group). (B) Body weights were measured daily and are depicted as percentage of initial body weight; *P < .05, **P < .01, ***P < .001, ****P < .0001 compared to untreated DhpsΔepi mice, and §P < .05, §§P < .01 versus Dhpsfl/fl + 4% DSS, by two-way ANOVA and Tukey test. (C) Colons were harvested, washed, weighed, and measured. (D) Histological injury was determined from H&E staining (E); the scale bars on the low-power and high-power photomicrographs correspond to 100 μm and 50 μm, respectively. (F) mRNA expression from the colonic mucosa; Dhpsfl/fl mice were used as control for the semi-quantitative analysis. In all panels with dot plots, *P < .05, **P < .01, ***P < .001 by two-way ANOVA and Tukey test.

