Figure 6.
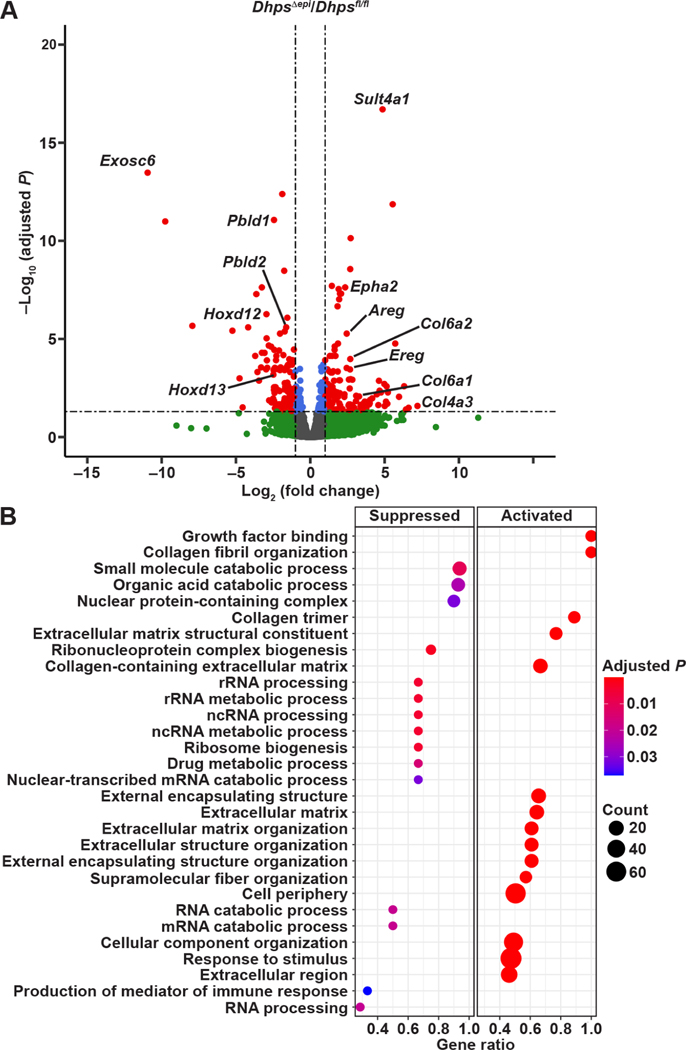
Transcriptomic changes orchestrated by DHPS in CECs. (A) RNA extracted from CECs from Dhpsfl/fl and DhpsΔepi (n = 3 mice per group) was sequenced, and the volcano plot corresponding to the DEGs in DhpsΔepi mice compared to Dhpsfl/fl animals was generated using R; red dots correspond to genes significantly (P < .05) up- or downregulated by 2–fold or more. All the genes are provided in Supplementary Table 4. (B) Pathway analysis of DEGs by GSEA; the complete list of pathways is shown in Supplementary Table 5.

