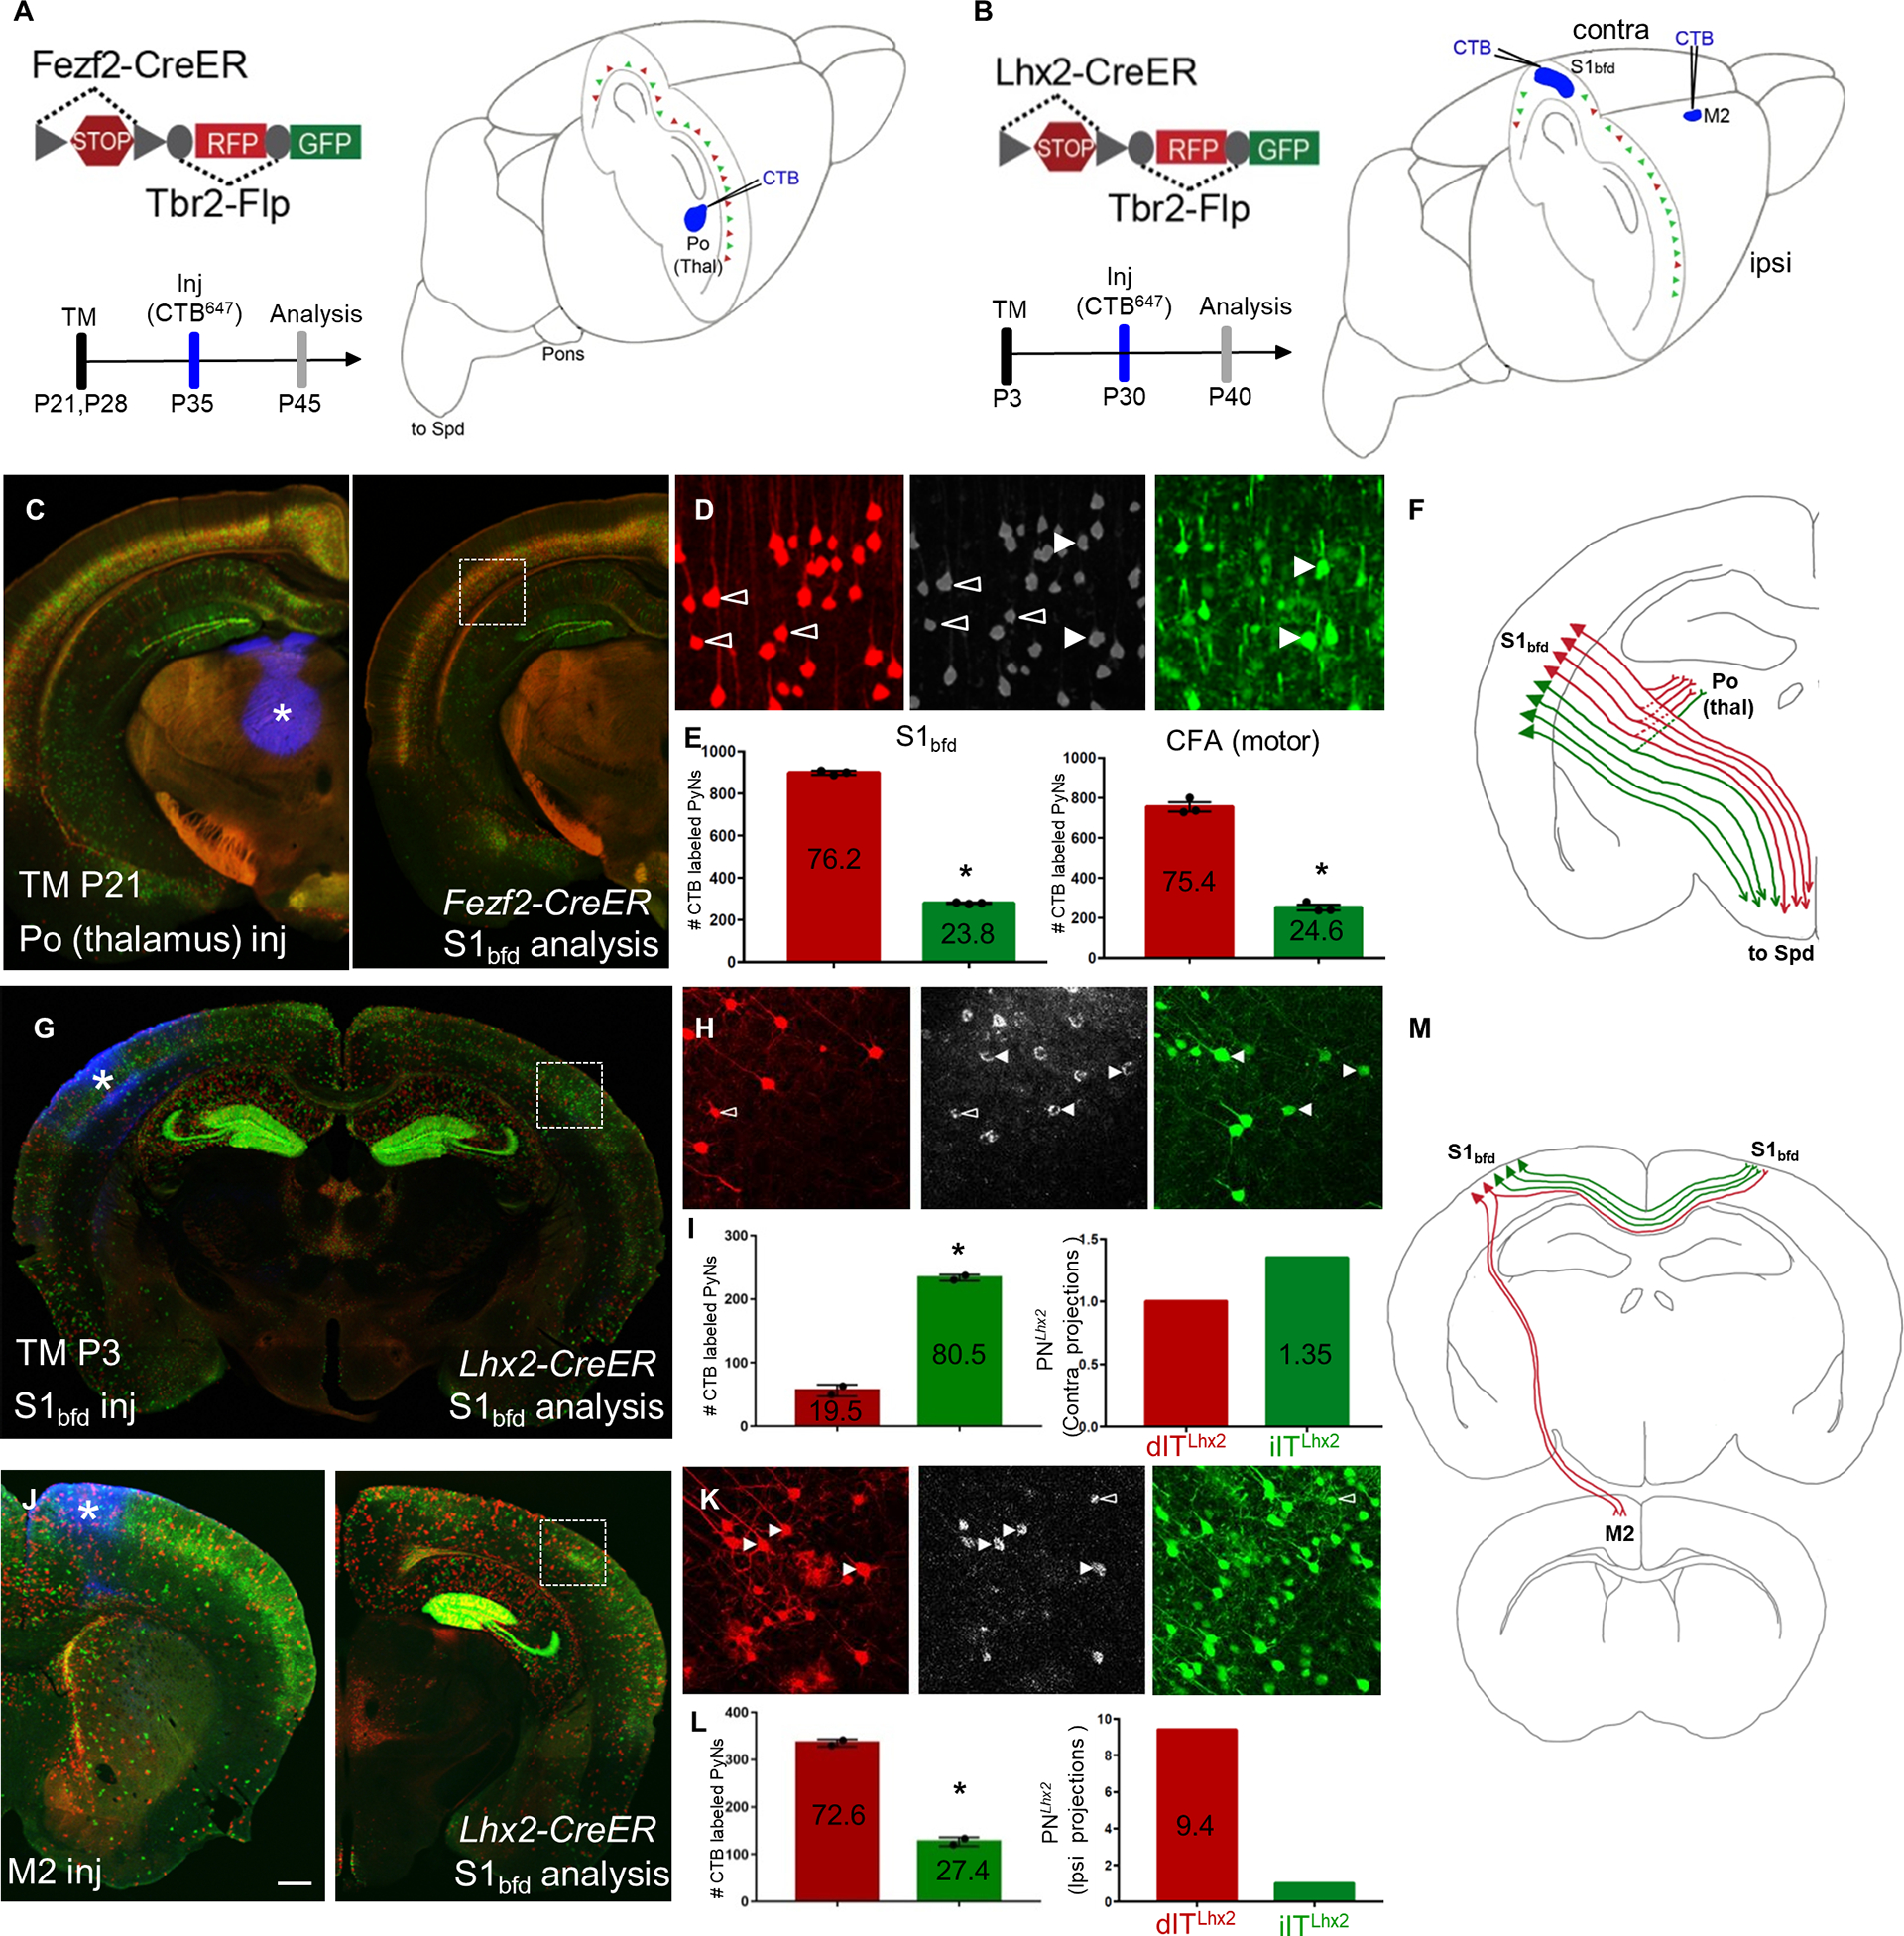
Figure 4: dPNsFezf2 and dPNsLhx2 in the neocortex project preferentially to higher-order thalamus and ipsilateral cortical areas, respectively.

(A-B) Schematics depicting retrograde CTB labeling from the Po (higher order) nucleus of thalamus in Fezf2-CreER;Tbr2-Flp;IS (PNsFezf2) mice induced at P21(A) or from either S1bfd or M2 in Lhx2-CreER; Tbr2-Flp;IS (PNsLhx2) mice induced at P3 (B).
(C) Coronal hemisection of the neocortex from a PNsFezf2 brain showing the injection site, Po (asterisk, left) and analysis in S1bfd (right).
(D) CTB labeling (middle panel) colocalized with dPNsFezf2 (open arrowheads, left panel) or iPNsFezf2 (white arrowheads, right panel).
(E) Quantification in S1bfd (left) showed 76.2% of CTB and RFP/GFP double labeled cells were dPNsFezf2 and 23.8% were iPNsFezf2. In the CFA (motor area), 75.4% of CTB and RFP/GFP double labeled cells were dPNsFezf2 and 24.6% were iPNsFezf2.
F) Schematic showing that dPNsFezf2 preferentially project to the higher-order thalamus when compared with iPNsFezf2.
(G) CTB injected in S1bfd (asterisk) of PNsLhx2 mice and analyzed for colocalization in the contraS1bfd.
(H) CTB (middle panel) colocalizes with more iPNsLhx2 (right panel arrowheads, GFP) and relatively fewer dPNsLhx2 (left panel open arrowheads, RFP) in contraS1bfd.
(I) Quantification shows that 80.5% of CTB-XFP double labeled cells were iPNsLhx2 and 19.5% were dPNsLhx2 (left). When normalized to the ratio of dPNsLhx2 and iPNsLhx2, iPNsLhx2 showed 1.35 fold more than dPNsLhx2 in projection to contrS1bfd.
(J) CTB injected in M2 (asterisk, left) and analyzed in PNsLhx2 mice in the ipsilateral, ipsiS1bfd (right)
(K) CTB colocalizes with more dPNsLhx2 (left panel white arrowheads, RFP) compared to iPNsLhx2 (right panel open arrowheads, GFP).
(L) Among CTB and RFP/GFP double labeled cells in ipsiS1bfd, 72.6% were dPNsLhx2 and 27.4% were iPNs Lhx2 (left). When normalized to the ratio of dPNsLhx2 and iPNsLhx2 in ipsiS1bfd, dPNsLhx2 showed a 9.4-fold higher projection to iM2 than iPNsLhx2.
(M) Summary schematic showing dPNsLhx2 preferentially projecting to ipsilateral cortical areas when compared with iPNsLhx2. Quantifications were performed in S1bfd or CFA from 1000 cells, 3–4 mice for PNsFezf2 in (E). Mean values are number of CTB labeled PNs ± SEM *P<0.0001 unpaired Student’s t-test (compared to dPN), unpaired Student’s t-test for both S1bfd and CFA. For PNsLhx2, 300–450 cells were counted from S1bfd in 3–4 animals in (I,L). Mean values are number of CTB labeled PNs ± SEM *P<0.0001 unpaired Student’s t-test (compared to dPN). Scale bars, low mag (C,G,J) 1mm; high mag (D,H,K) 100μm. Abbreviations: Po, posterior nucleus of thalamus; Thal, thalamus; S1bfd, primary somatosensory barrel field cortex; M2, secondary motor cortex; inj, injection; CFA, caudal forelimb area; Spd, spinal cord; TM, tamoxifen induction. See also Figures S6–S8.
