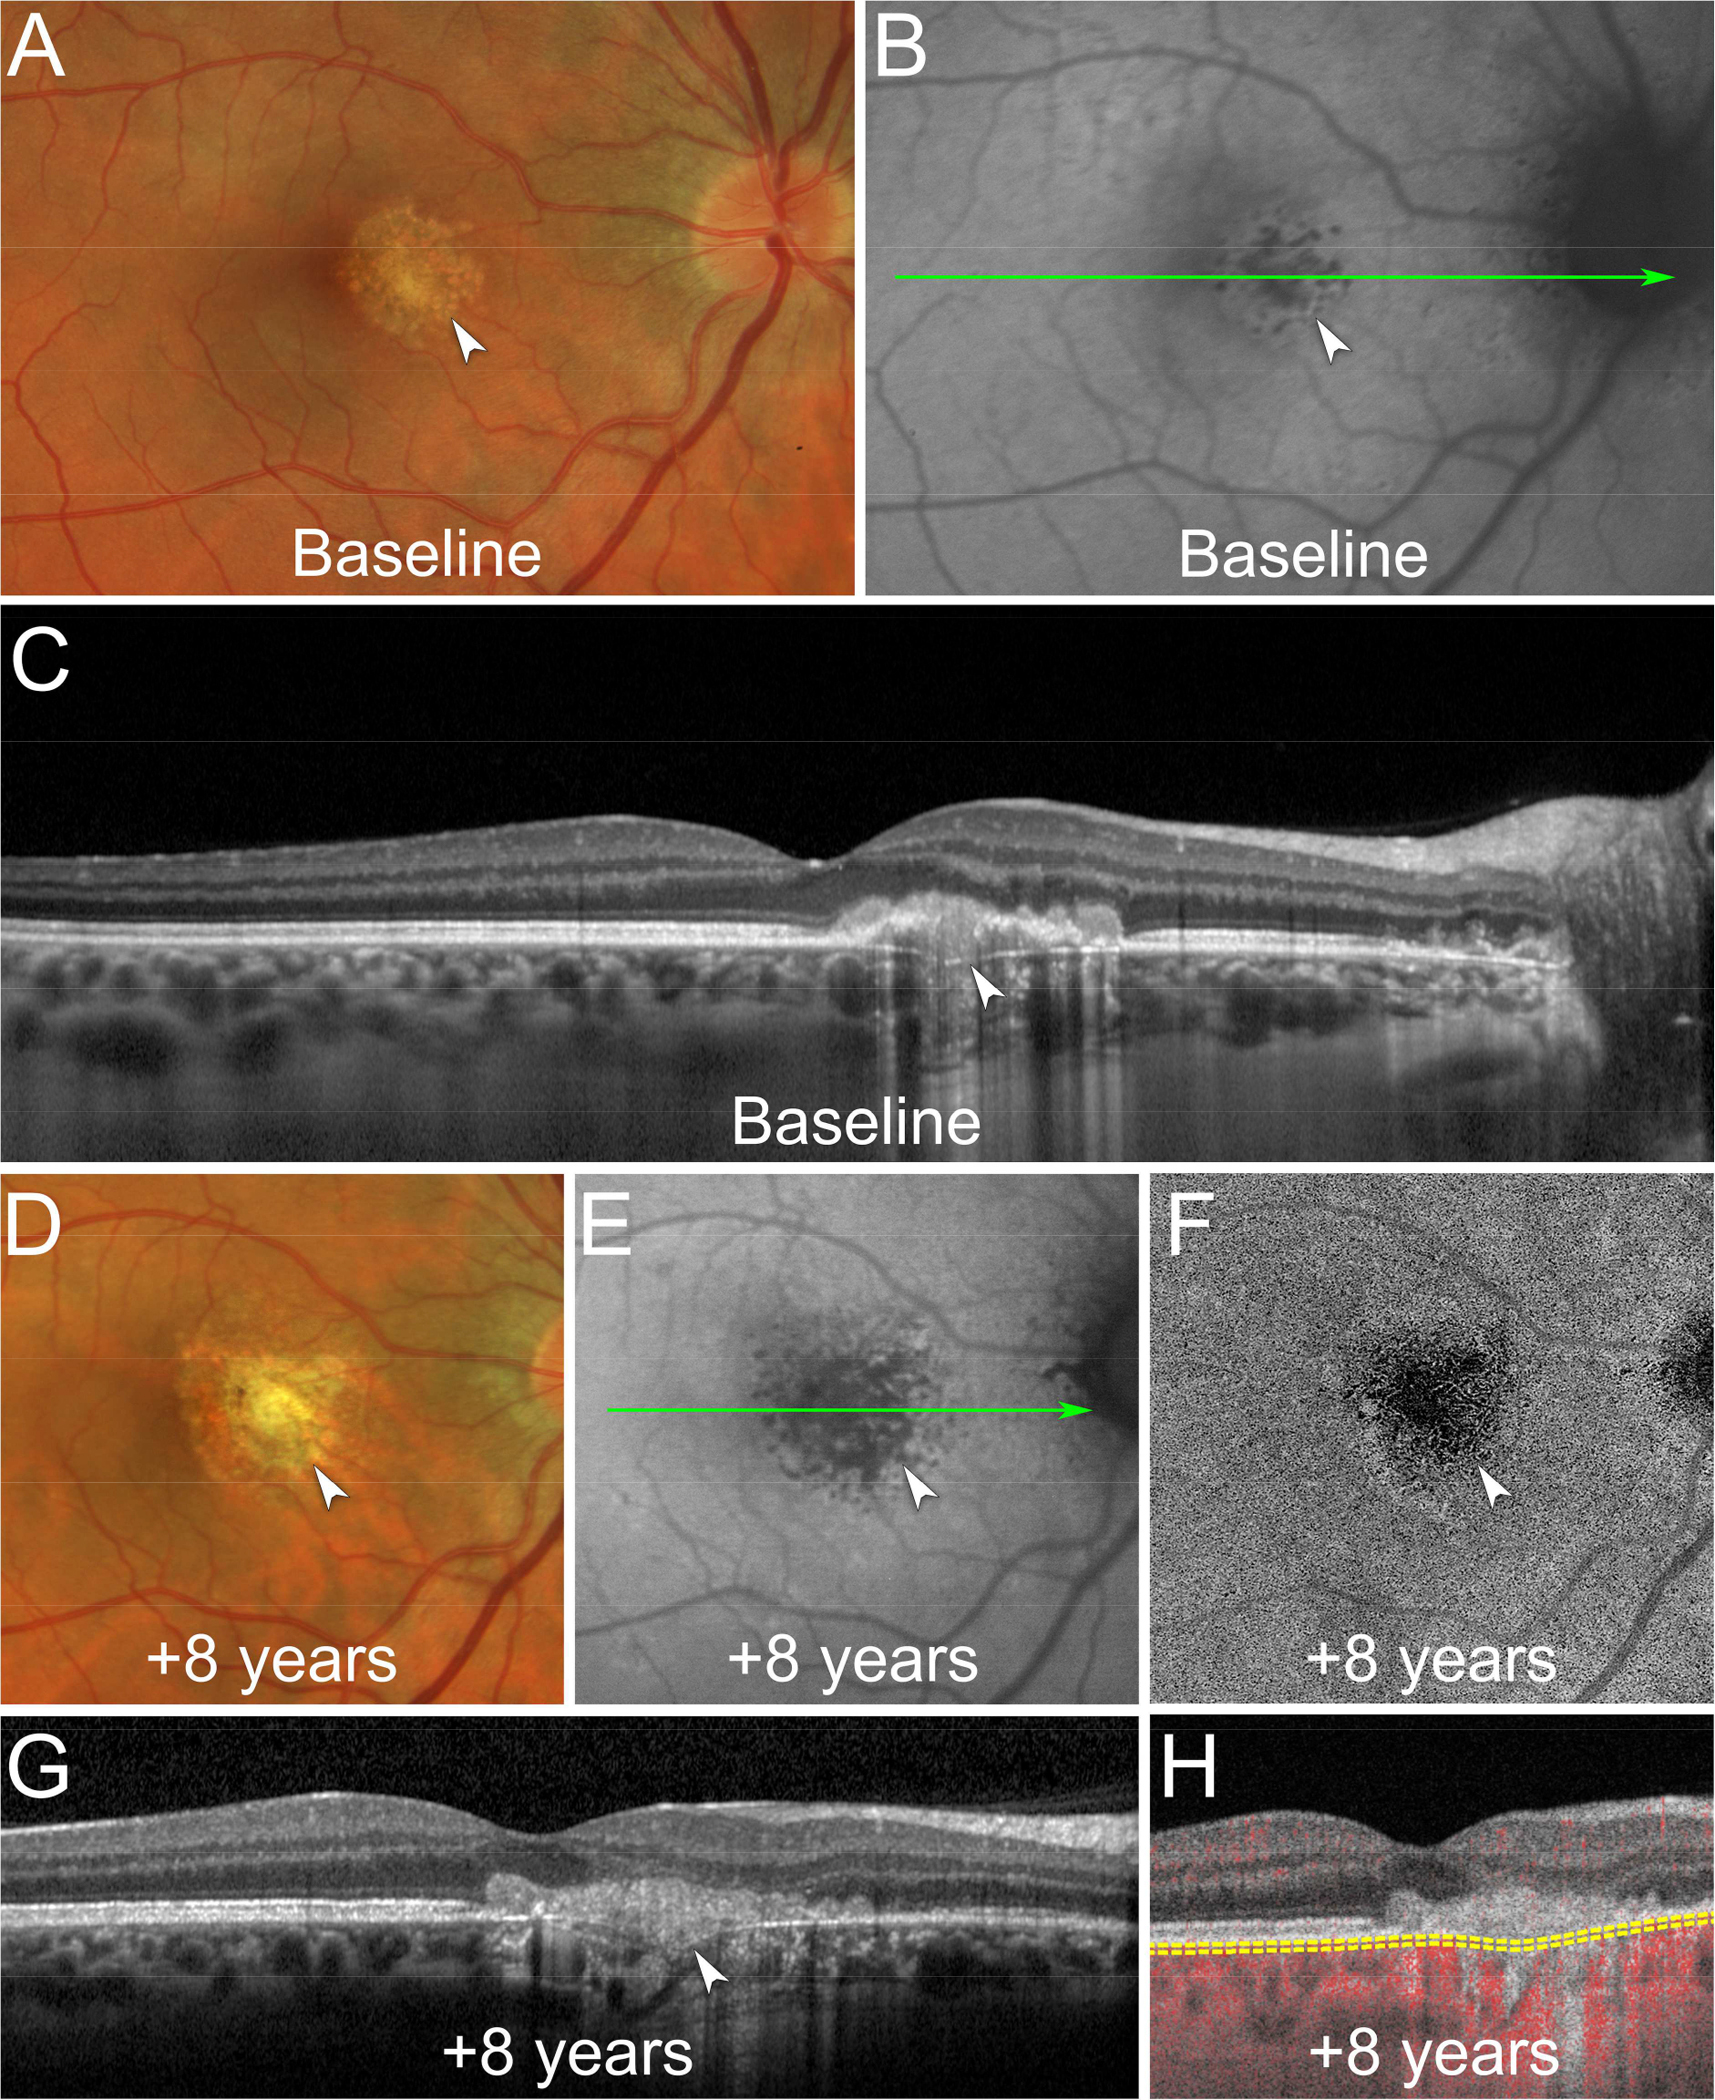
Figure 2. Multimodal imaging of a recurrent macular chrysanthemum lesion.

A. At baseline, color fundus photography shows a chrysanthemum lesion in the macula with a grey-yellow central lesion surrounded by pale satellite dots (white arrowhead).
B. Fundus autofluorescence image shows a hypoautofluorescent chrysanthemum lesion in the macula (white arrowhead). The green line indicates the location of the optical coherence tomography (OCT) B-scan displayed in (C).
C. OCT B-scan shows subretinal hyperreflective material splitting the retinal pigment epithelium/Bruch’s membrane (RPE/BrM) complex, a downwardly deflected BrM defect, and posterior choroidal hypertransmission (white arrowhead). The underlying choroid shows focal thickening and loss of the normal choroidal architecture.
D. At 8-year follow-up, color fundus photography shows recurrence of the chrysanthemum lesion (white arrowhead).
E. Fundus autofluorescence shows a larger hypoautofluorescent chrysanthemum lesion (white arrowhead). The green line indicates the location of the OCT B-scan displayed in (G).
F. En face swept-source OCT-angiography (OCTA) segmented at the level of the choriocapillaris shows flow signal deficit colocalizing with the chrysanthemum lesion (white arrowhead).
G. OCT B-scan shows a new hyperreflective material splitting the RPE/BrM complex (white arrowhead).
H. Cross-sectional OCTA shows flow signal deficits of the choriocapillaris colocalizing with the recurrent chrysanthemum lesion. The yellow dashed lines indicate the segmentation used to obtain the en face OCTA image displayed in (F).
