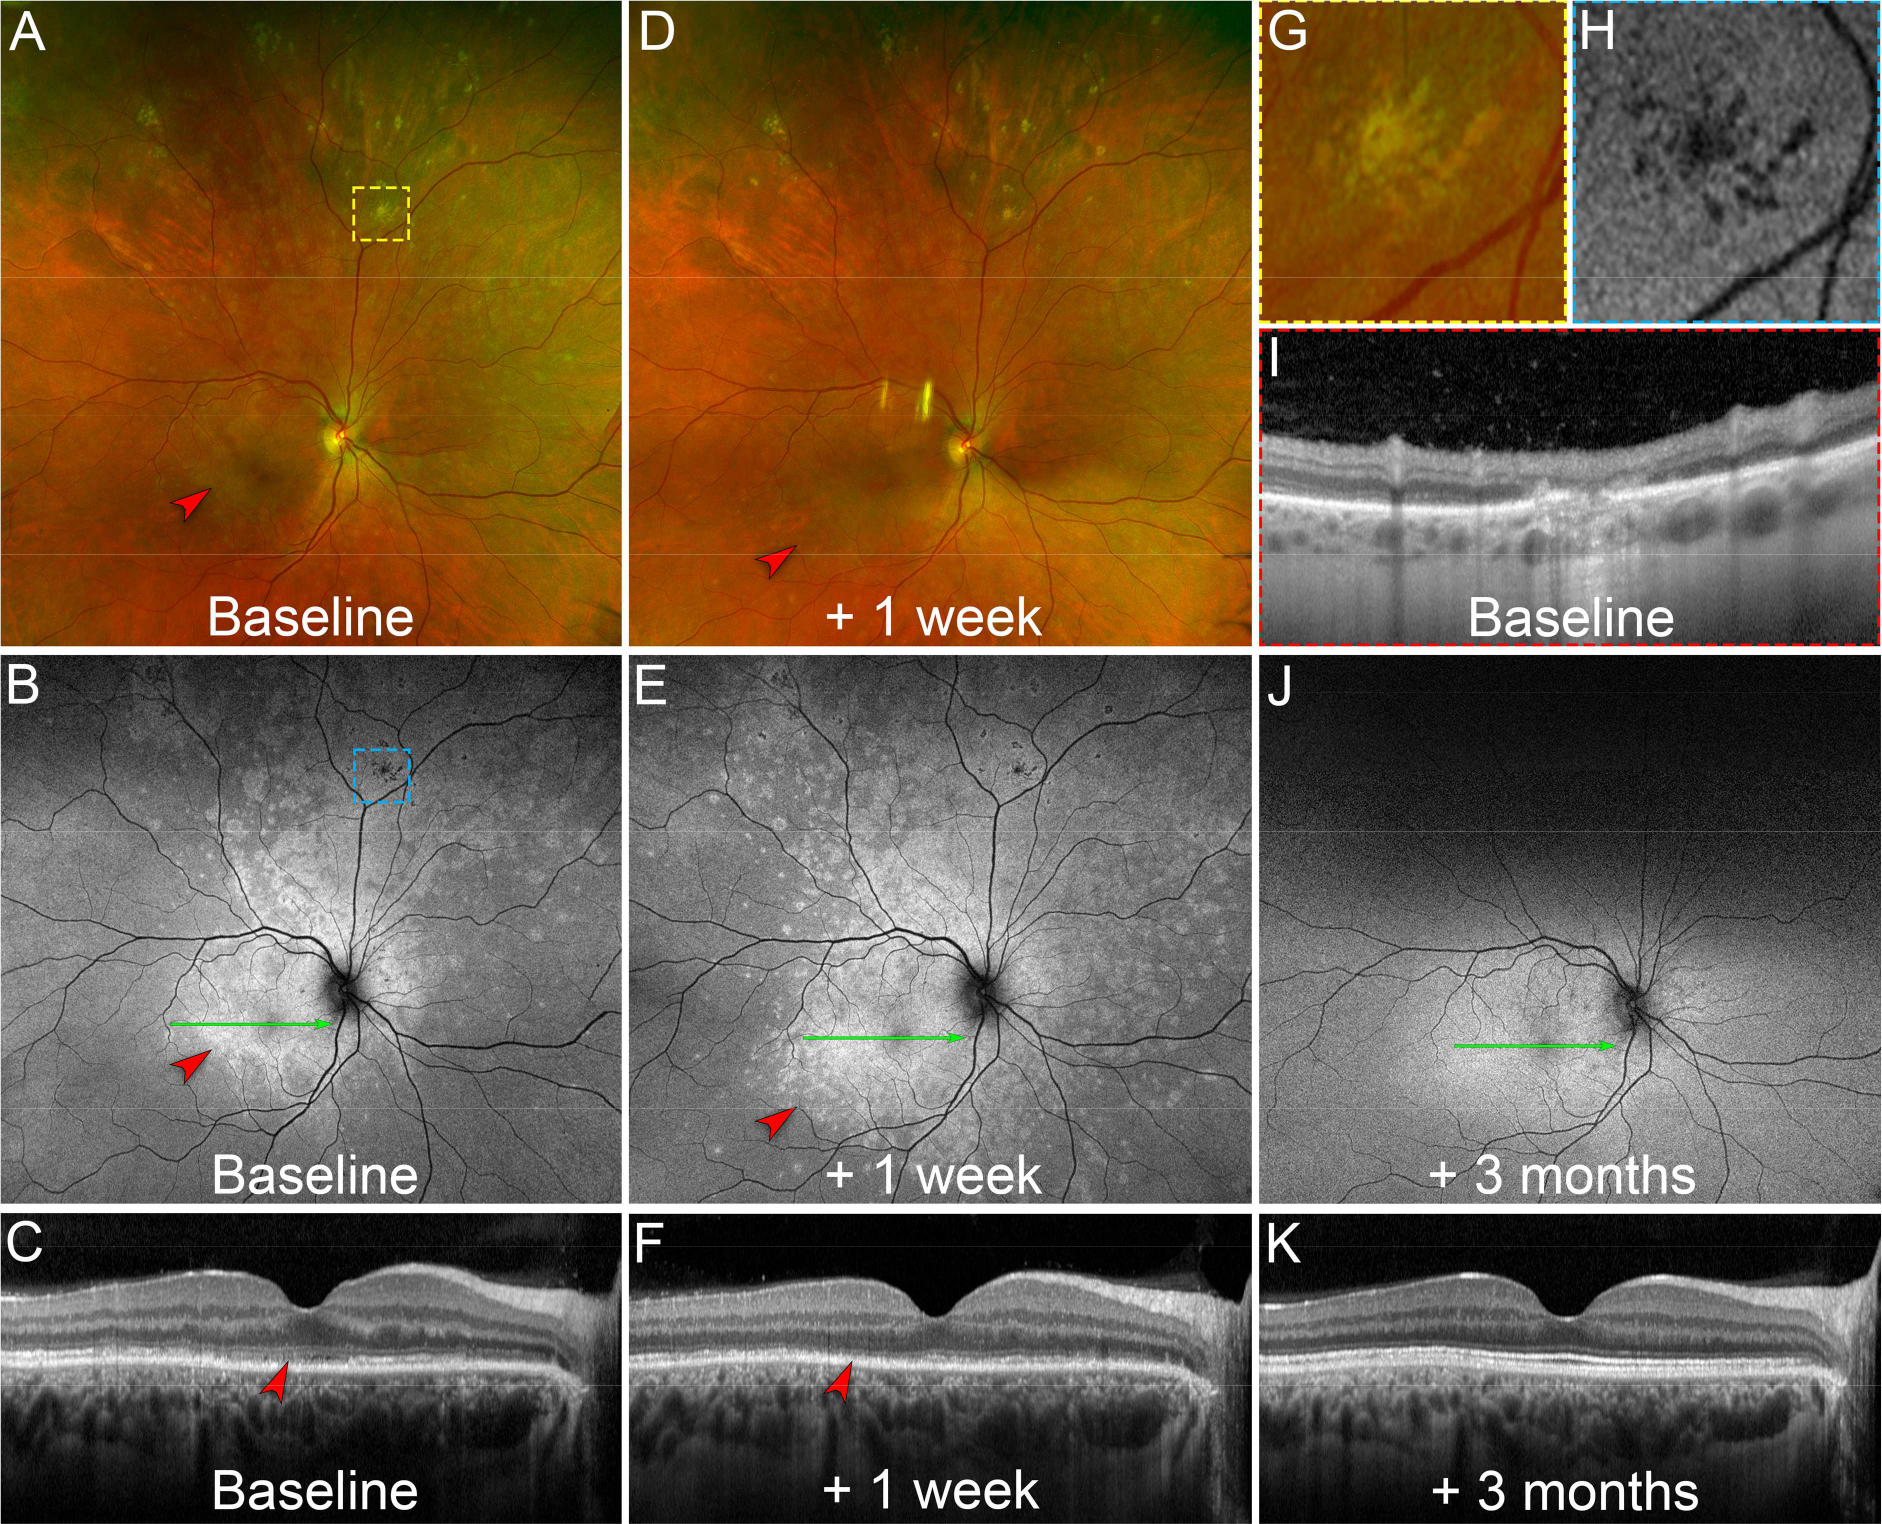
Figure 4. Differential responses of chrysanthemum idiopathic multifocal choroiditis (iMFC) and epiphenomenon multiple evanescent white dot syndrome (EpiMEWDS) to corticosteroid therapy.

A. At baseline, ultra-widefield pseudocolor fundus photography of the right eye shows chrysanthemum lesions in the superior mid- and far-peripheral retina (yellow dashed box). Note the multifocal white lesions in the macula (red arrowhead) corresponding to EpiMEWDS. The yellow dashed box indicates the location of the magnified view displayed in (G).
B. Baseline ultra-widefield fundus autofluorescence image shows hypoautofluorescent chrysanthemum lesions superiorly (blue dashed box) and hyperautofluorescent areas corresponding to EpiMEWDS (red arrowhead). The blue dashed box indicates the location of the magnified view displayed in (H). The green line indicates the location of the optical coherence tomography (OCT) B-scan displayed in (C).
C. Baseline OCT B-scan shows disruption of the ellipsoid (EZ) and interdigitation zones (IZ) in the macula corresponding to EpiMEWDS (red arrowhead). The patient’s visual acuity was 20/80 in the right eye.
D. After 1 week of oral corticosteroid (1mg/kg/day), ultra-widefield pseudocolor fundus photography shows regression of the chrysanthemum lesions superiorly without new lesions. Note the paradoxical extension of the multifocal white lesions in the macula (red arrowhead) corresponding to EpiMEWDS.
E. At 1-week, ultra-widefield fundus autofluorescence image shows stable hypoautofluorescent chrysanthemum lesions. Note the extension of the hyperautofluorescent EpiMEWDS in the macula (red arrowhead). The green line indicates the location of the OCT B-scan displayed in (F).
F. At 1-week, OCT B-scan shows extension of the EZ and IZ disruption in the macula (red arrowhead). The patient’s visual acuity decreased to 20/200 in the right eye.
G. Magnified view of the chrysanthemum lesion at baseline on pseudocolor fundus photography. Note the distinctive morphology of the chrysanthemum lesion characterized by a grey-yellow central lesion surrounded by satellite dots.
H. Magnified view of the hypoautofluorescent chrysanthemum lesion at baseline on fundus autofluorescence imaging.
I. Baseline OCT B-scan through the chrysanthemum lesion displayed in (G) and (H). Note the subretinal hyperreflective material splitting the retinal pigment epithelium/Bruch’s membrane and associated with posterior hypertransmission, focal choroidal thickening and loss of the normal choroidal architecture.
J. After 3 months and gradual taper of the corticosteroid therapy, ultra-widefield fundus autofluorescence image shows regression of the hyperautofluorescent EpiMEWDS. The green line indicates the location of the OCT B-scan displayed in (K).
K. At 3-month, the OCT B-scan shows restoration of the EZ/IZ bands in the macula. The patient’s visual acuity improved to 20/20 in the right eye.
