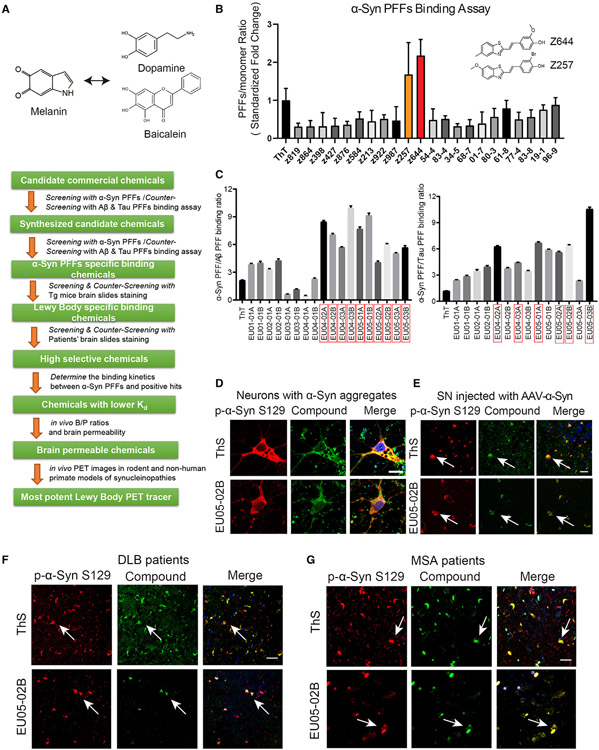
Figure 1. Drug design strategy and screening of potential imaging agents for synucleinopathies.
For a Figure360 author presentation of Figure 1, see https://doi.org/10.1016/j.cell.2023.06.004
(A) The screening strategy of α-Syn PET tracers.
(B) Screening candidate chemicals using spectrophotometric assay with α-Syn PFFs. The emission wavelength was determined based on the excitation wavelength of each chemical. The PFF/monomer binding ratio was standardized by the ThT binding fold change. Error bars represent the mean ± SEM. Data are representative of 7 independent experiments.
(C) The second round of screening of candidate chemicals with the α-Syn PFF versus Aβ/Tau PFF binding ratios. Error bars represent the mean ± SEM. Data are representative of 5 independent experiments.
(D) Confocal fluorescence images of neurons containing α-Syn aggregates. The neurons were infected with AAV-α-Syn at days in vitro (DIV) 7 and transduced with α-Syn PFFs at DIV 12. The samples were immunostained with anti-p-α-Syn S129 (pseudocolors were converted to red) together with ThT or EU05-02B (0.1 μM). Scale bars, 10 μm.
(E) Double staining of α-Syn aggregates in AAV-α-Syn A53T-injected mouse SN with pS129 antibody and EU05-02B or ThS. EU05-02B sensitively captured α-Syn aggregates in the SN (arrows). Scale bars, 20 μm.
(F) Double staining of α-Syn aggregates in the cortex of DLB patients with pS129 antibody and EU05-02B or ThS. Scale bars, 20 μm.
(G) Double staining of α-Syn aggregates in the SN of MSA patients with pS129 antibody and EU05-02B or ThS. Scale bars, 20 μm.
See also Figures S1 and S2.

