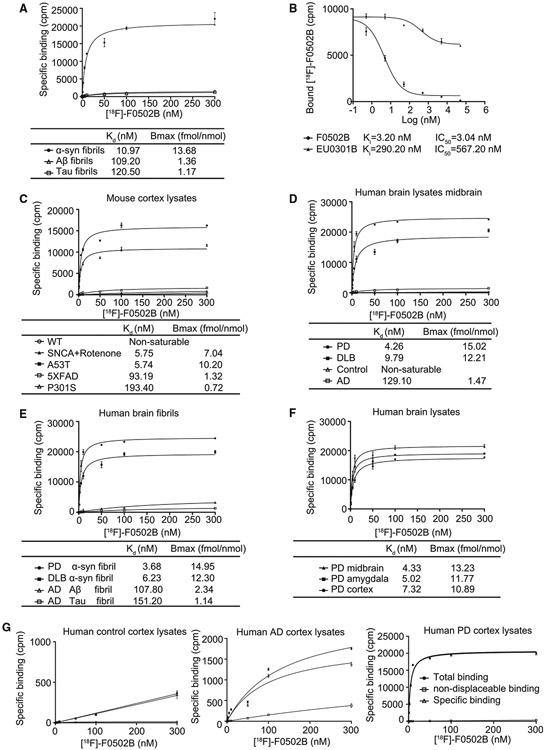
Figure 3. [18F]-F0502B binding affinity and selectivity to different protein aggregates in vitro.
(A) Quantification of binding affinities. The binding affinities of [18F]-F0502B to α-Syn, Aβ, or Tau PFFs were determined in saturation binding studies. Data points represent the mean ± SD. Similar results were obtained in more than three independent experiments.
(B) [18F]-F0502B competitive binding assays with α-Syn PFFs. Data points represent the mean ± SD.
(C) F0502B saturation binding assays with unfractionated AD/PD/control mouse brain homogenates. The α-Syn aggregates in SNCA transgenic mice treated with rotenone or AAV-α-Syn A53T-injected mice displayed strong binding activities with a Kd of 5.75 nM. Data points represent the mean ± SD.
(D and E) F0502B saturation binding assays with unfractionated human PD/DLB/AD/control brain homogenates and insoluble protein fractions from human PD/DLB/AD/brain samples. Both PD and DLB brain homogenates and insoluble fractions exhibited robust binding activities with Kd values of 4.26/9.79 and 3.68/6.23 nM, respectively. Data points represent the mean ± SD.
(F) F0502B saturation binding assays of unfractionated human PD brain homogenates from different brain areas. Bmax (fmol/nmol) = CPM/(2.22 * 1012 dpm/Ci * 0.75 cpm/dpm *2,000 Ci/mmol *10−12 mmol/fmol *0.5 nmol). All of the brain regions, including the midbrain, amygdala, and cortex, displayed prominent binding activities. Midbrain homogenates show the strongest binding. Error bars represent the mean ± SD. Data are representative of 3 independent experiments.
(G) Total, specific, and non-displaceable binding (NDB) from saturation binding studies with [18F]-F0502B in the frontal cortex of healthy control, AD, and PD patients. NDB was defined by self-block at 100 × Kd concentration. Error bars represent the mean ± SD. Data are representative of 3 independent experiments.
See also Figure S3F.

