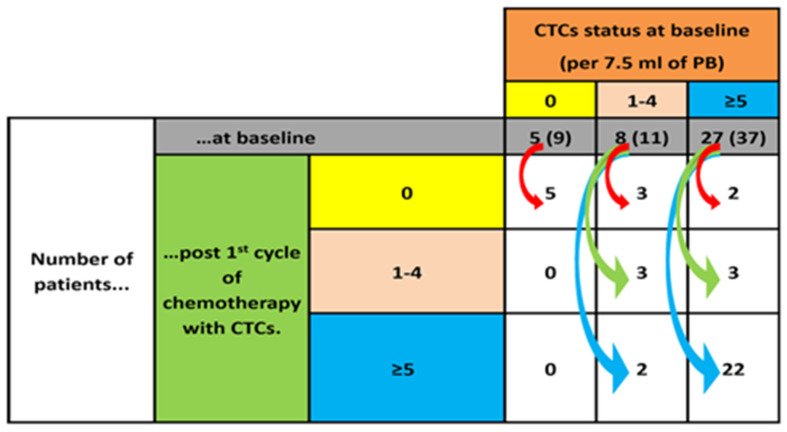
Figure 1.
Changes in CTC counts after the first cycle of chemotherapy. For each CTC count category at baseline (0, 1–4 and ≥5 CTCs; horizontal colored boxes), the number of patients belonging to each category is shown (grey boxes). The arrows show how these patients migrate to different CTC categories (vertical-colored boxes) after the first cycle of chemotherapy. Patients that had adequate biological material both at baseline and after the first chemotherapy cycle were included in this analysis. The number in the brackets refers to the number of patients that were analyzed for their baseline sample.

