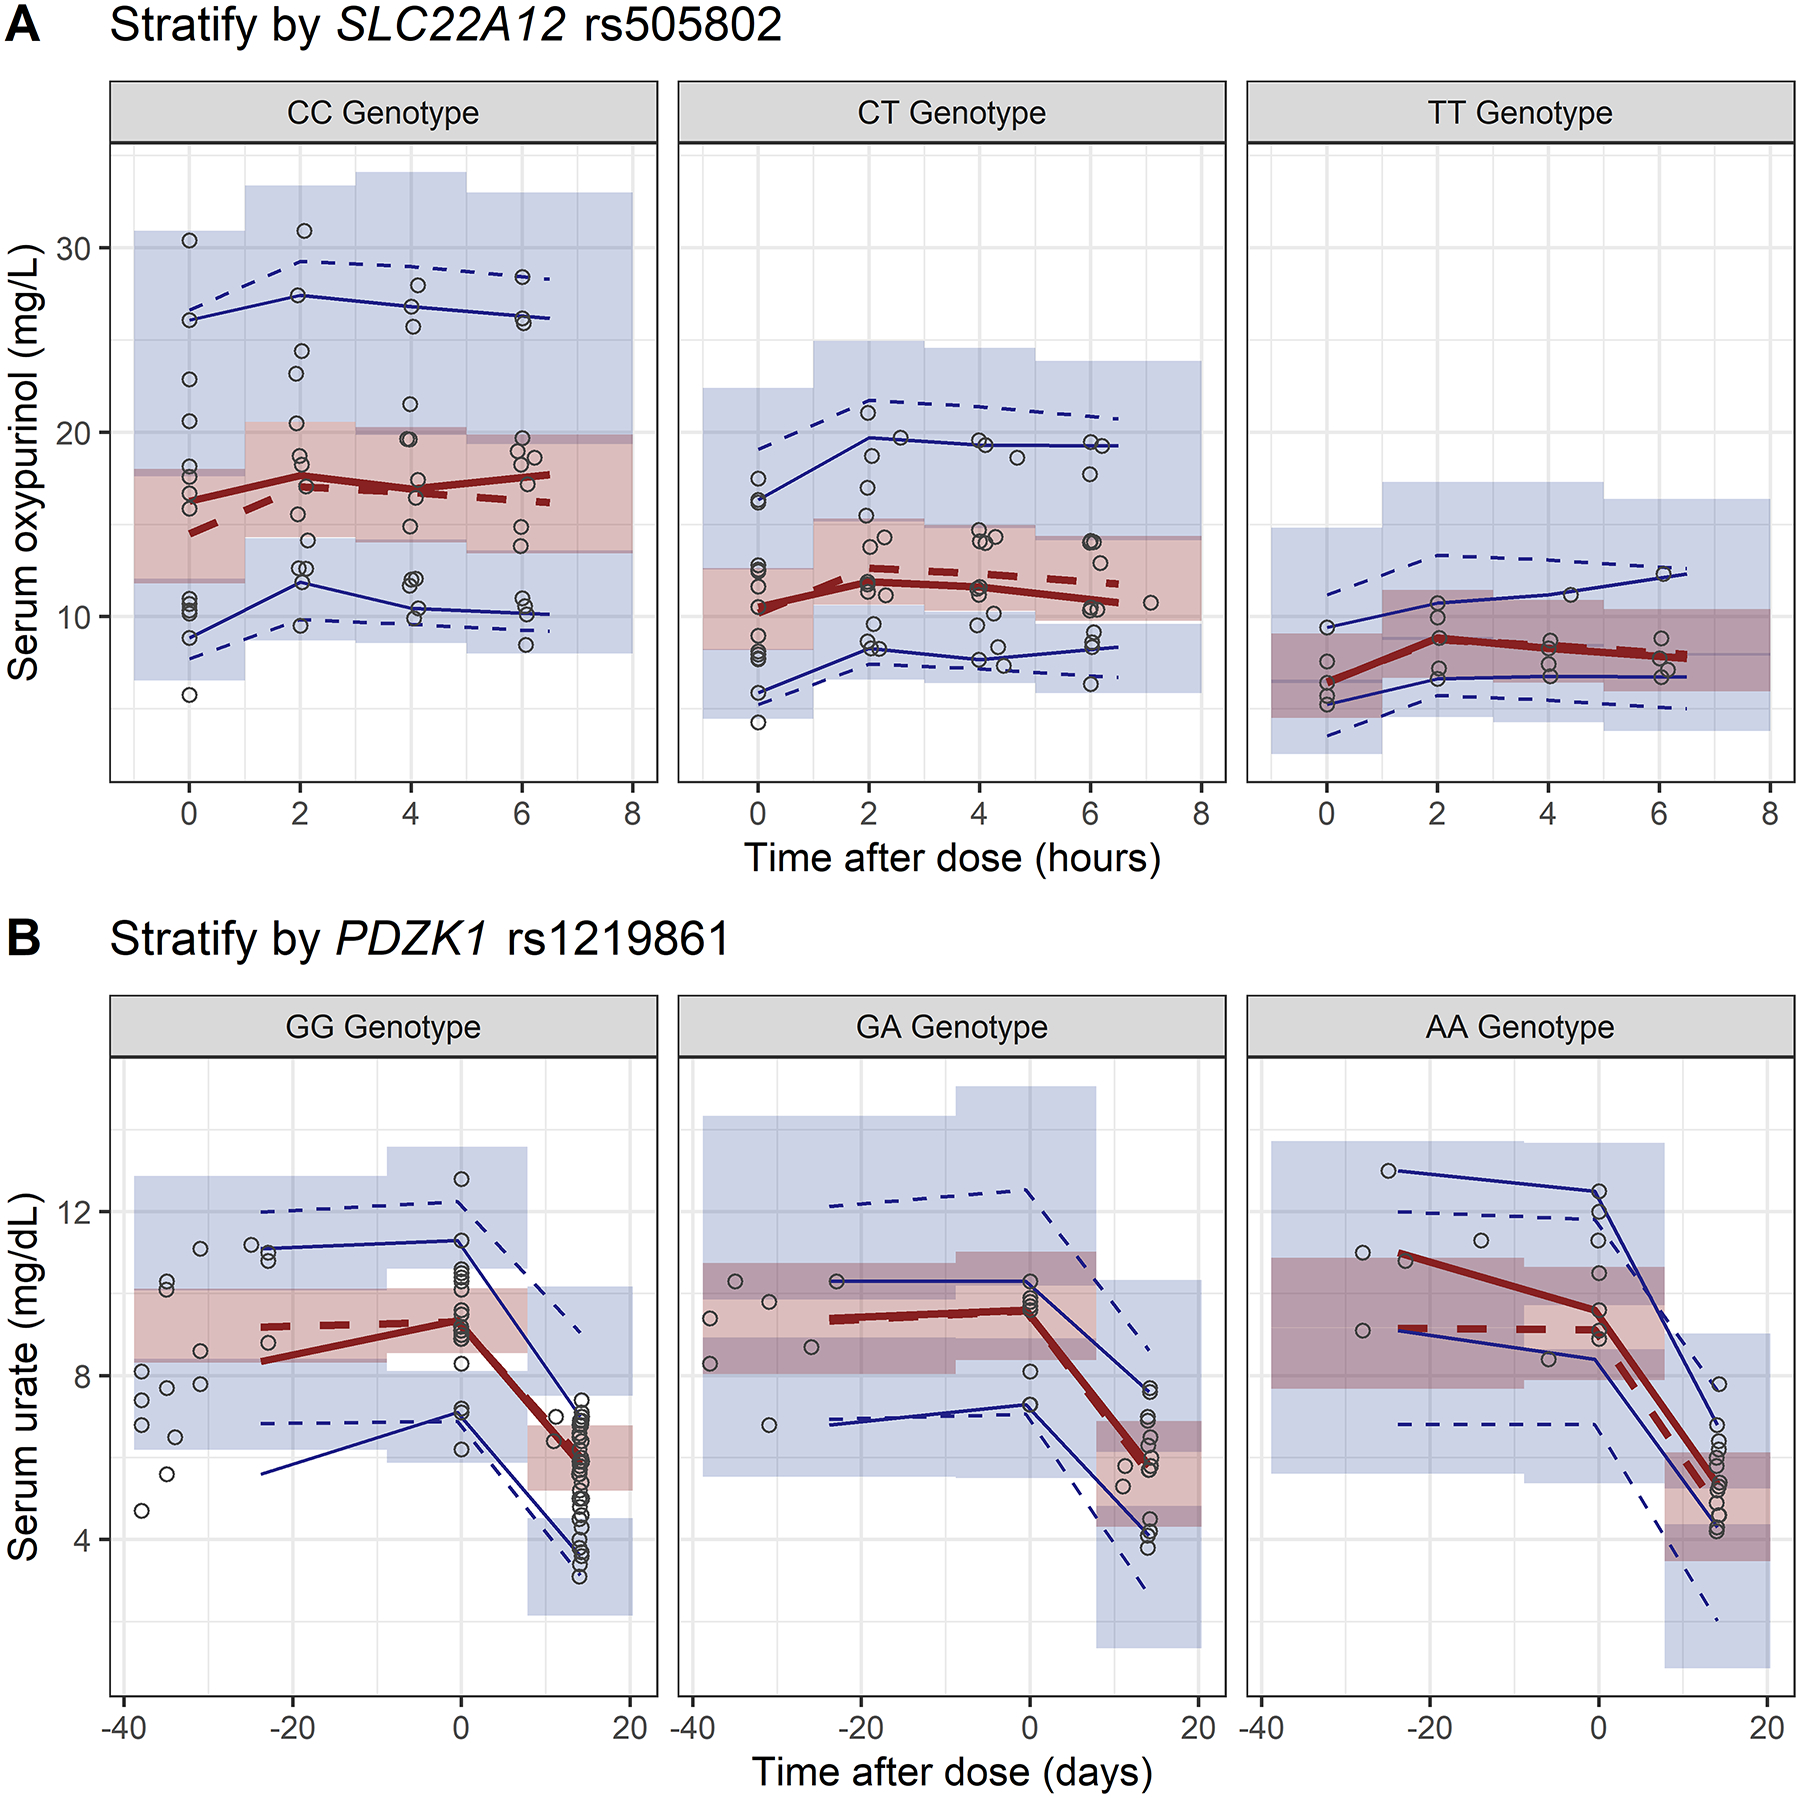
Figure 3.

Visual predictive checks of the final PKPD models for oxypurinol.
A, serum oxypurinol concentration stratified by SLC22A12 rs505802 genotypes.
B, serum urate concentration stratified by PDZK1 rs12129861 genotypes.
The open circles represent the observed data. The blue (5th and 95th) and red (50th) solid and dashed lines represent the percentiles of the observed and simulated data, respectively. The shaded areas are the 95% confidence intervals of the simulated concentrations for the corresponding percentile values.
