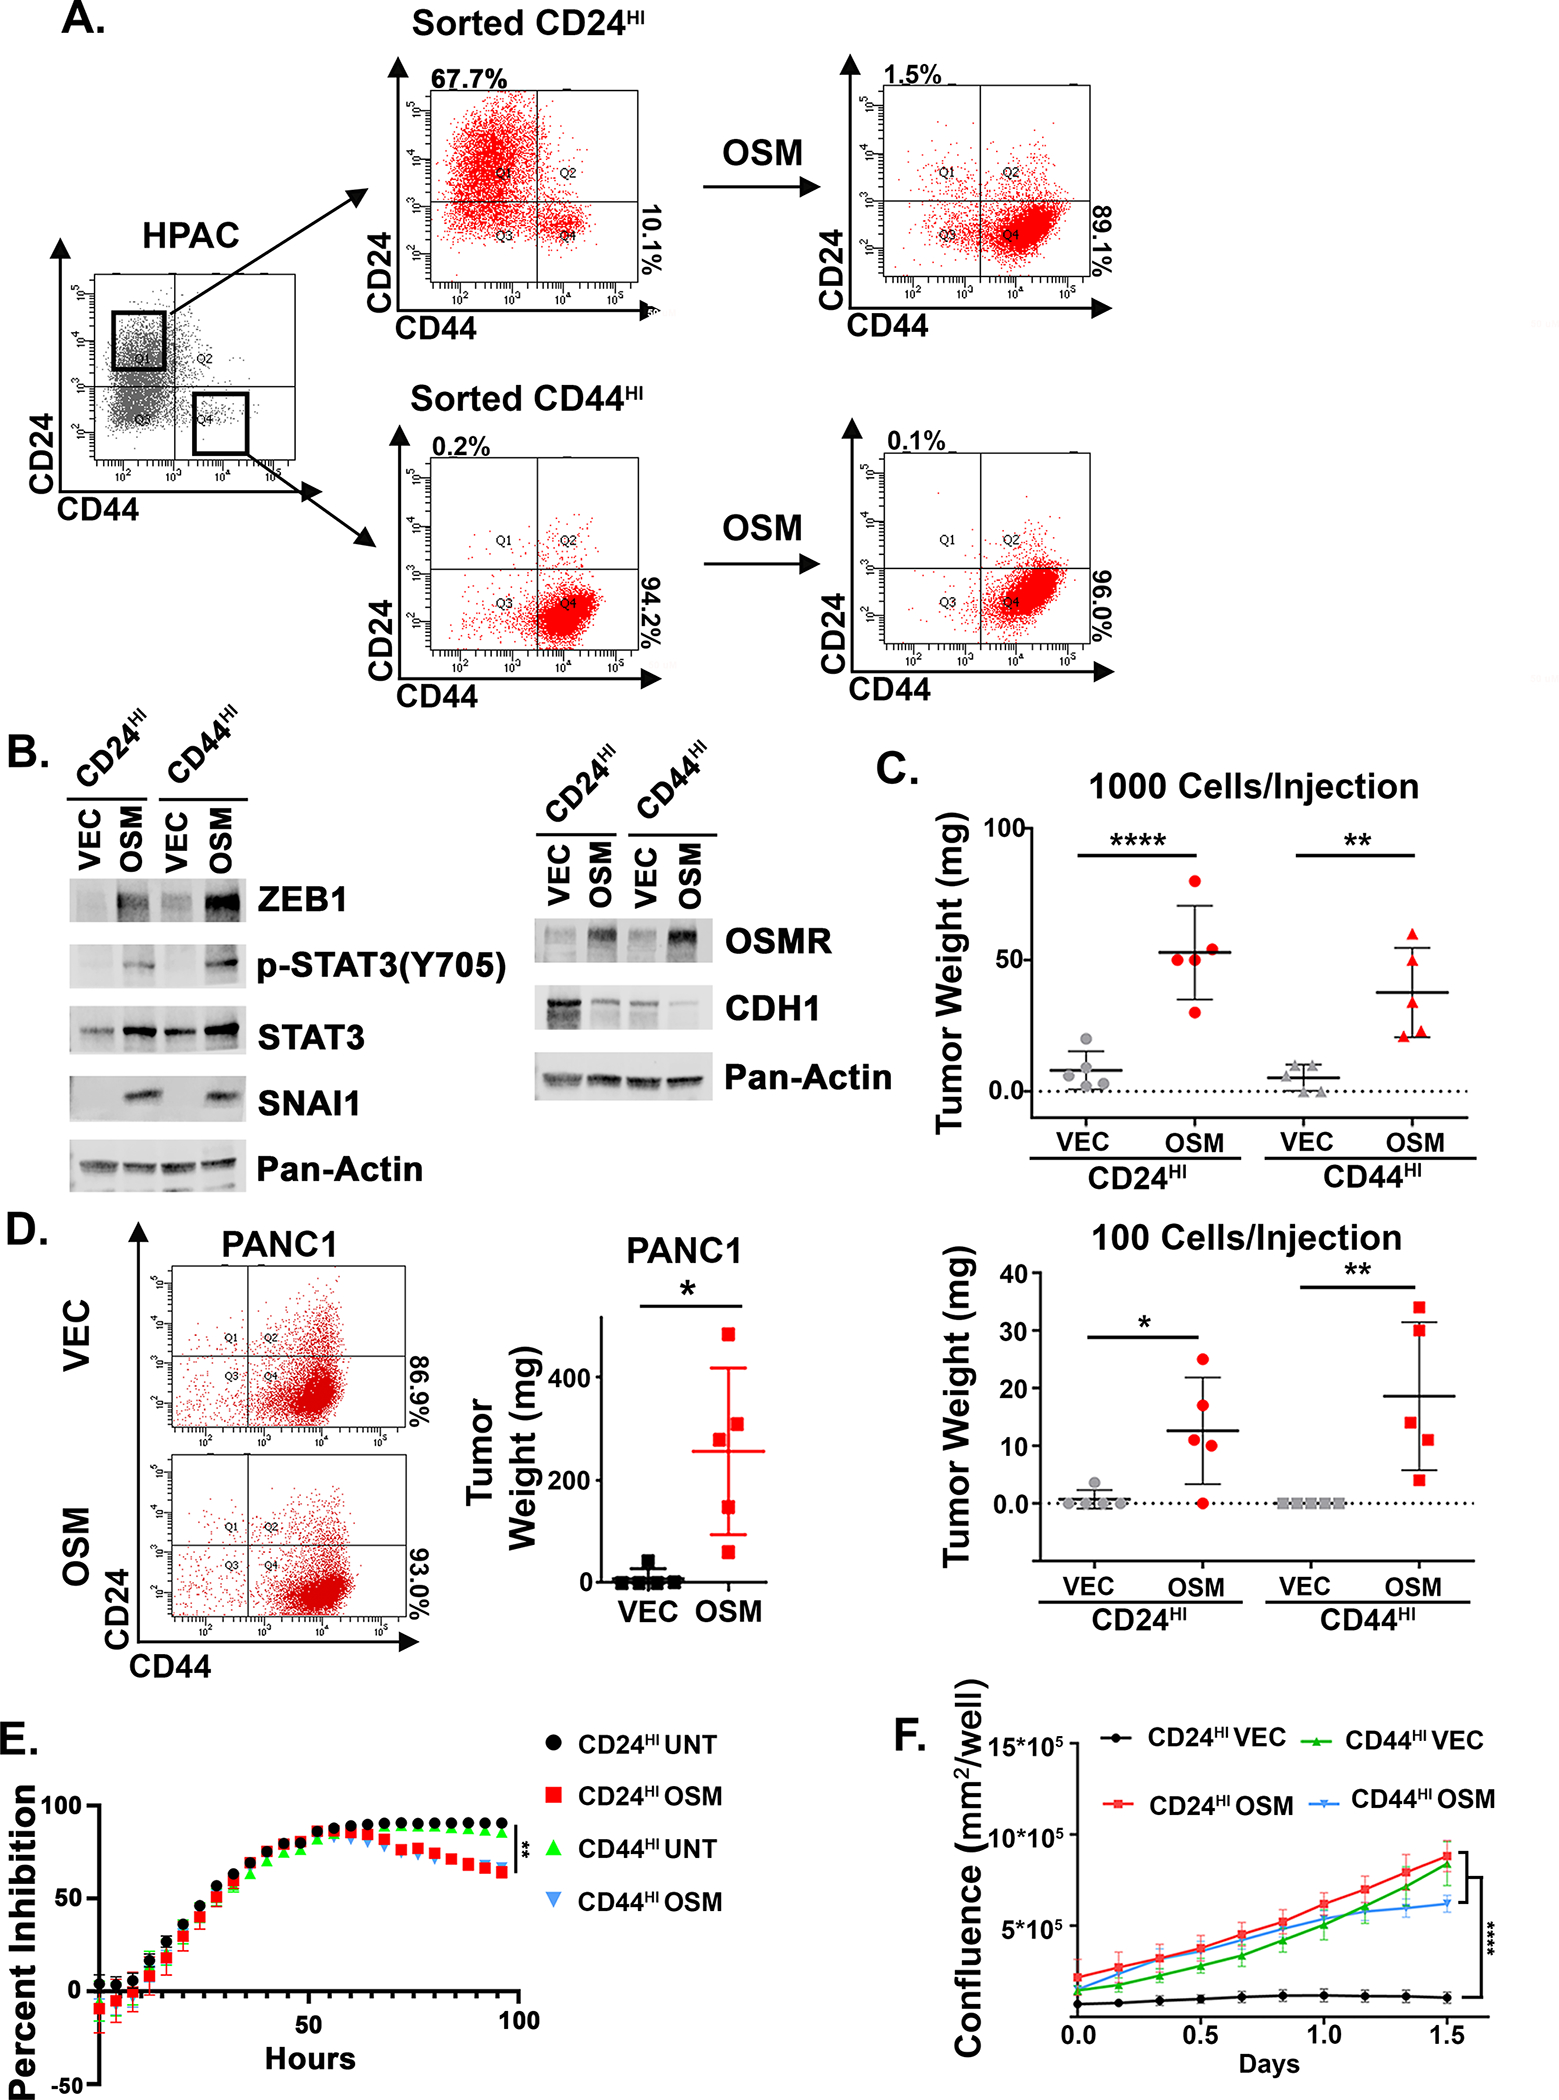
Figure 1: OSM induces tumor-initiation independently of its ability to induce a CD44HI/mesenchymal phenotype.

A, B HPAC cells were sorted using FACS for CD24HI/CD44LO (referred to as CD24HI) and CD24LO/CD44HI (referred to as CD44HI). CD24HI and CD44HI cells were infected with lentiviruses encoding OSM (or control, VEC) and assessed by flow cytometry for CD24 and CD44, and Western blot as indicated. C HPAC derivatives were subcutaneously injected into the flanks of nude mice at the indicated cell numbers and tumor development was monitored over 1 month. Data were calculated using a Mann-Whitney test and shown as mean ± S.D. *P<0.05, **P<0.01, ****P<0.0001. D PANC1 cells were infected with lentiviruses encoding OSM (or control, VEC). Cells were assessed by flow cytometry and 1 million cells were injected subcutaneously into mice and monitored over 1 month. Data are shown as a mean ± S.D., and statistical significance was determined by t-test where *P<0.05. E CD24HI and CD44HI HPAC cells were pre-treated with recombinant OSM (10 ng/mL) for 48 hours before 16 nM of gemcitabine or vehicle was added; cell numbers were continuously monitored and quantified from several random fields within each well for an additional 96 hours using an Incucyte imager. Data are plotted as cell number in gemcitabine at a specific timepoint divided by cell number of the corresponding untreated control at the same timepoint. Statistical significance was determined by two-way ANOVA where **P<0.01. F Transwell migration of HPAC derivatives was quantified from several random fields within each well for an additional 96 hours using an Incucyte imager and are shown as mean ± S.D. Statistical significance was determined by two-way ANOVA where ****P<0.0001.
