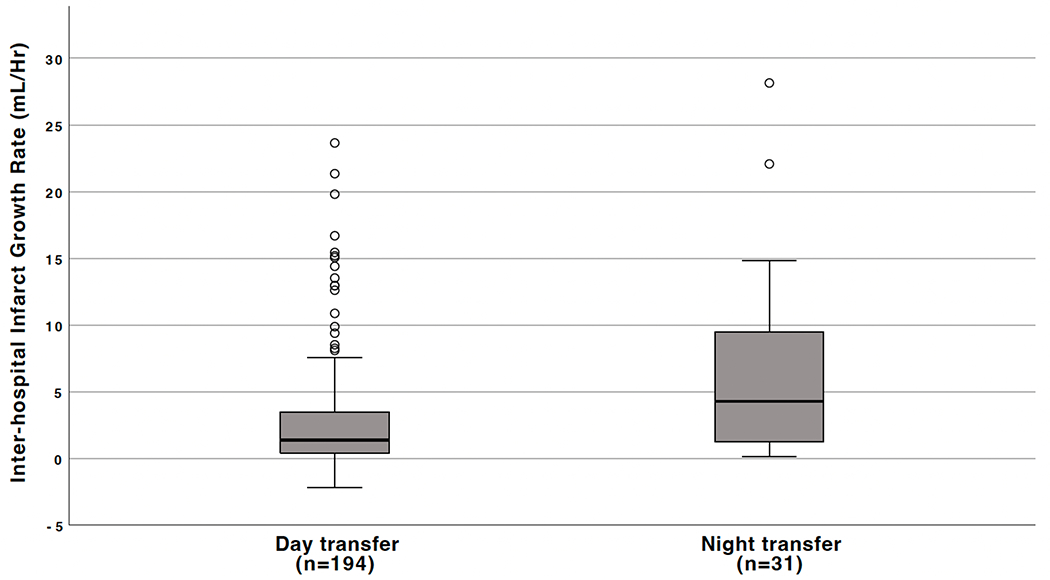
Figure 2. Relationship between Inter-hospital Infarct Growth Rate and Time of Transfer.

The box represents the upper and lower quartiles, the short black line within the box represents the median, the whiskers represent the 5th and 95th percentiles, and the circles extreme values.
