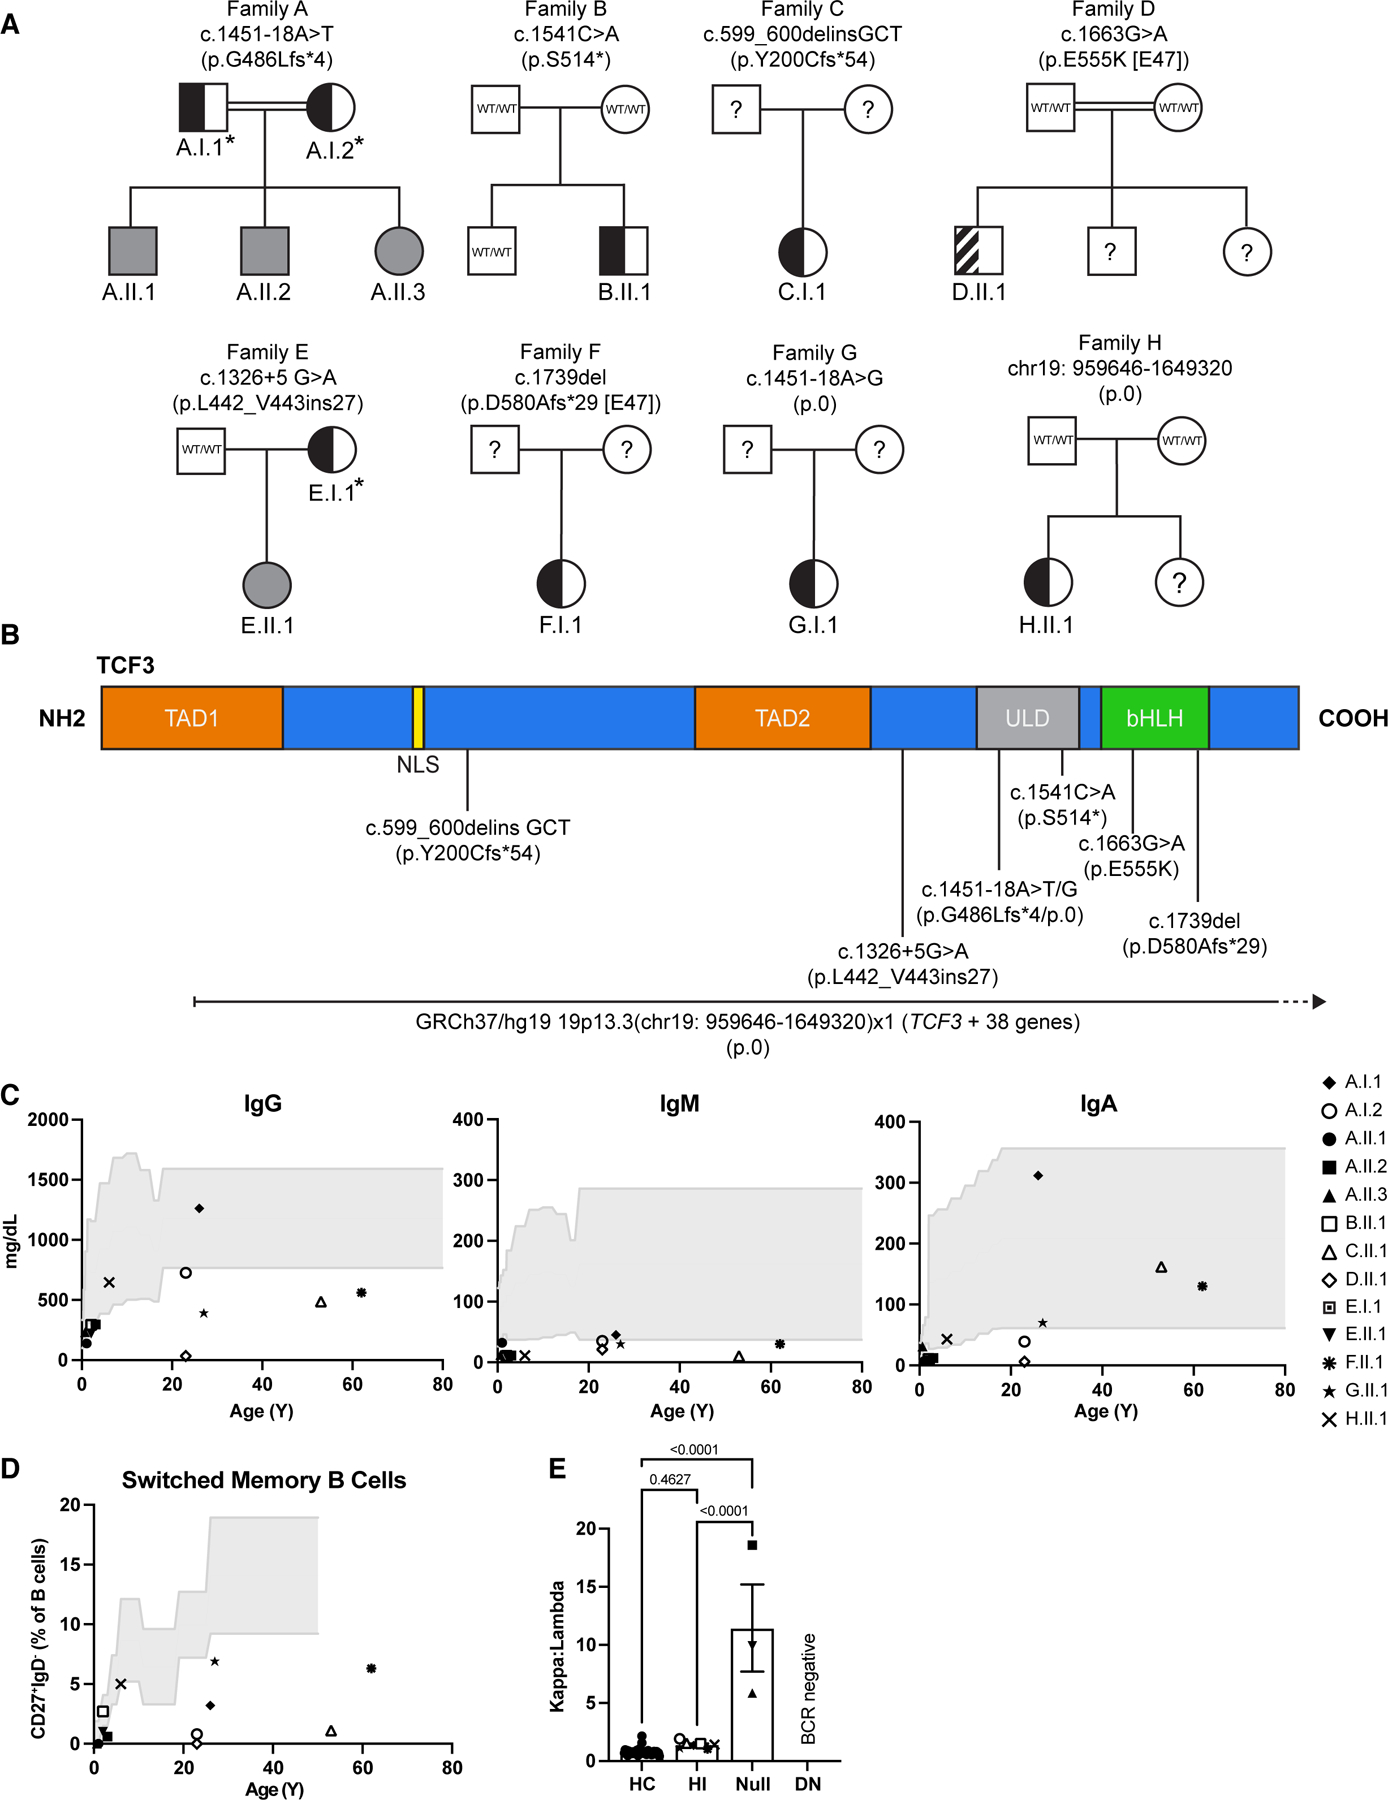
Figure 1:

Pedigree analysis and clinical manifestations of families with TCF3 variants. (A) Pedigrees of 8 kindreds with different TCF3 variants (families A–H). Individuals with heterozygous and homozygous variants are shown in semi-shaded (black) and shaded (gray) symbols respectively, question marks indicate unscreened individual, asterisks indicate mutation positive asymptomatic individuals, the striped semi-shaded square refers to the known DN variant. (B) Schematic representation of the TCF3 protein and corresponding domains. Predicted effect of each mutation on the amino acid sequence and its location are shown. Numbers indicate cDNA and amino acid location. TAD1: transactivation domain 1; NLS: nuclear localization sequence; TAD2: transactivation domain 2; ULD: ubiquitin-like domain; bHLH: basic helix-loop-helix. (C) Immunoglobulin levels in the serum for each tested individual as denoted by unique symbols, compared with healthy control ranges over age (gray shaded area). (D) Frequency of switched memory B cells (CD27+IgD−) in the blood, determined by flow cytometry. (E) Igκ to Igλ ratio of B cells in the blood, determined by flow cytometry. Bars show the average for each group ± SEM, one-way ANOVA with Tukey correction, each patient is represented by a unique symbol. HC: healthy control, HI: haploinsufficient, DN: dominant negative.
