Figure 4:

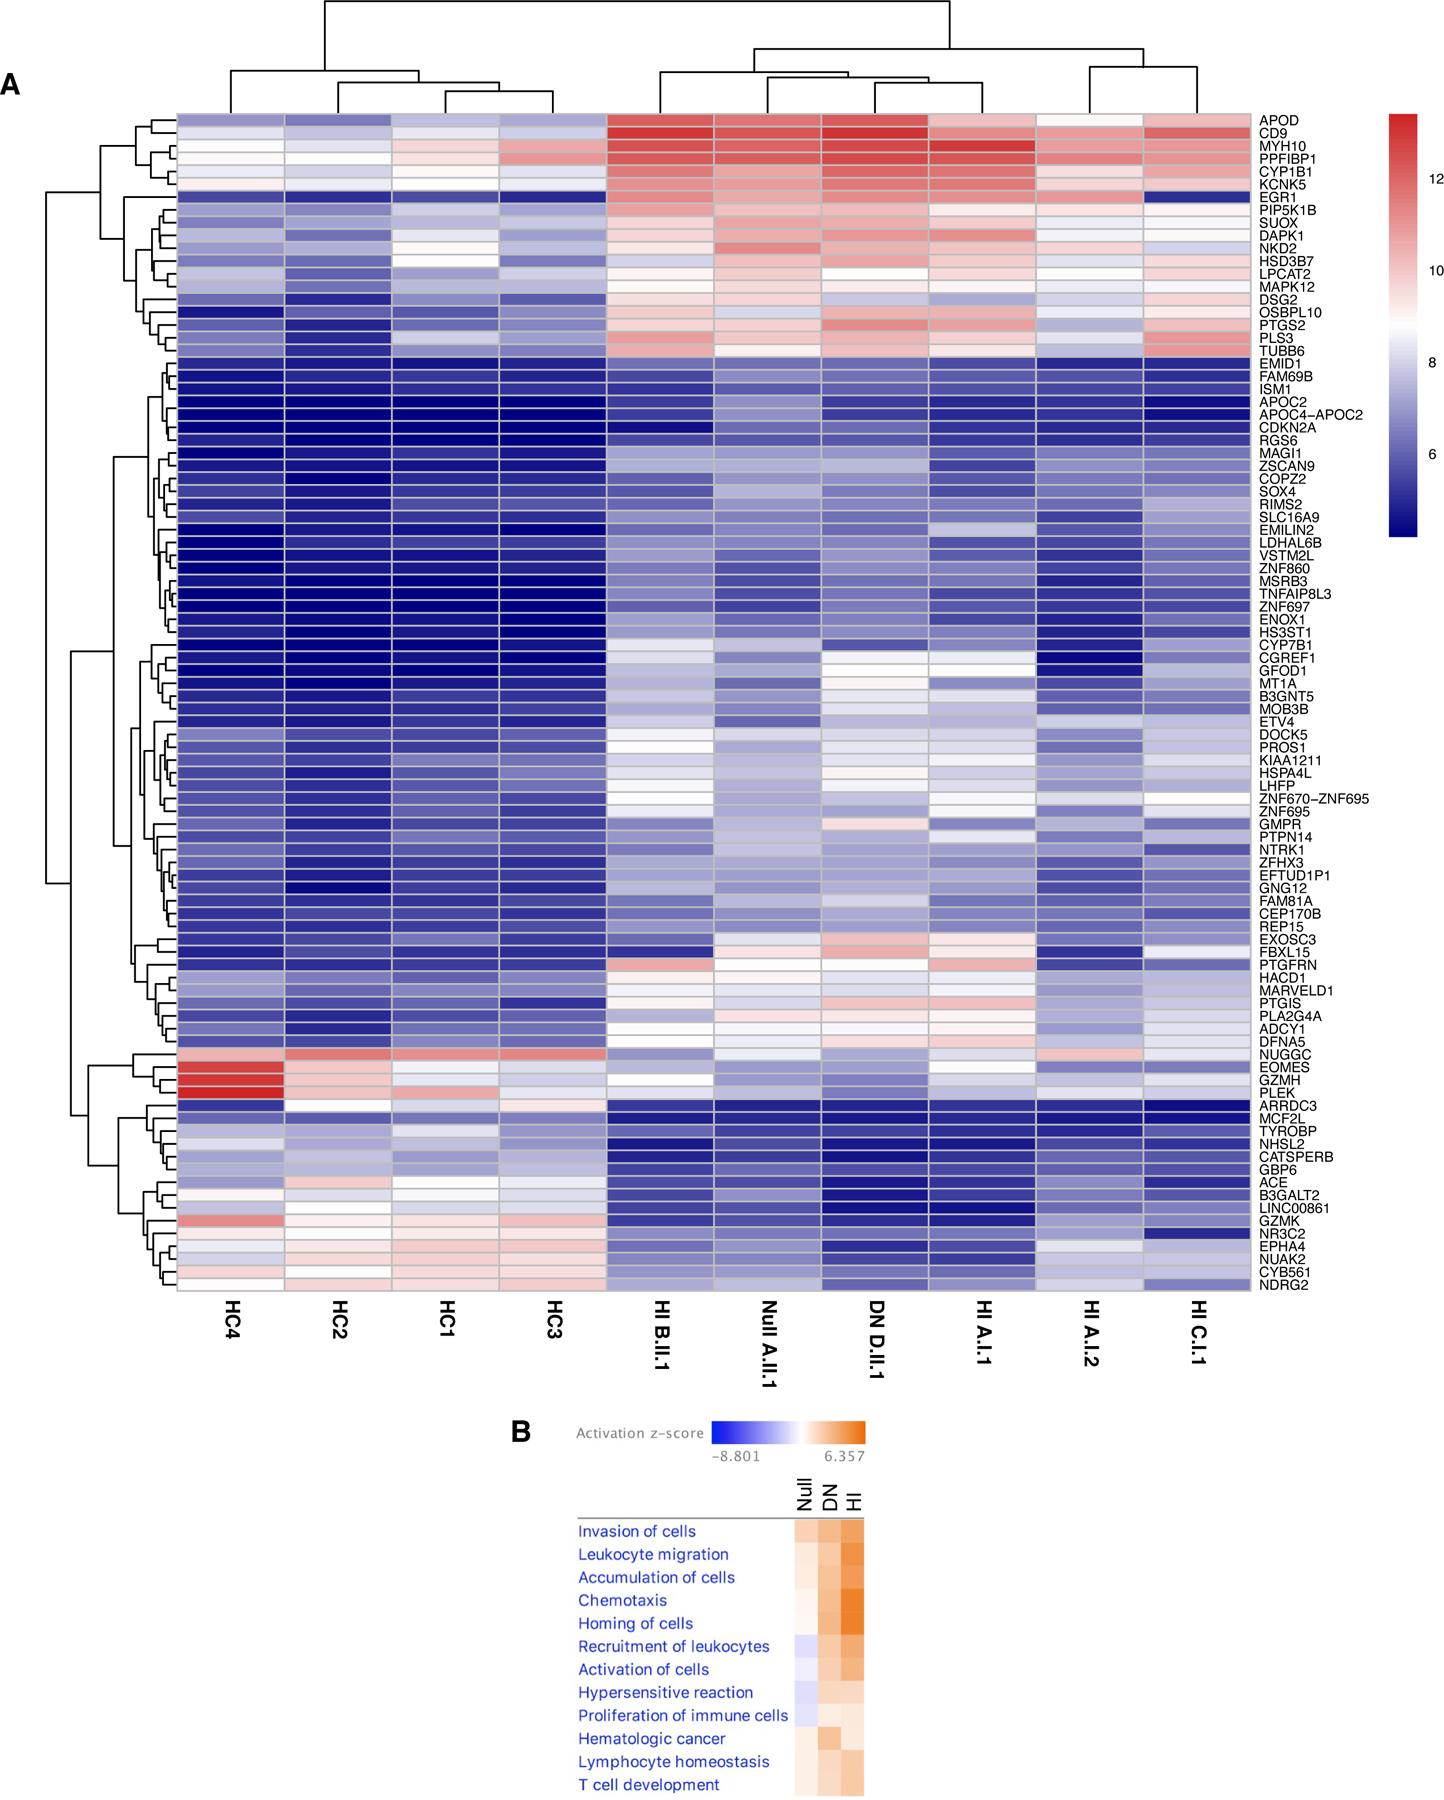
Null, DN, and HI TCF3 variants change the mRNA landscape of T cell blasts compared with healthy controls. (A) Heatmap of commonly differentially expressed genes in healthy controls (HC), haploinsufficient (HI), null, and dominant negative (DN) individuals. (B) Ingenuity Pathway Analysis comparing diseases & biofunctions in null, DN, and HI TCF3 individuals. (A-B) Healthy controls (n=4), TCF3 null (n=1; A.II.1), TCF3 HI (n=4; A.I.1, A.I.2, B.II.1 and C.II.2), TCF3 DN (n=1; D.II.1). Two technical replicates were performed for each individual.
