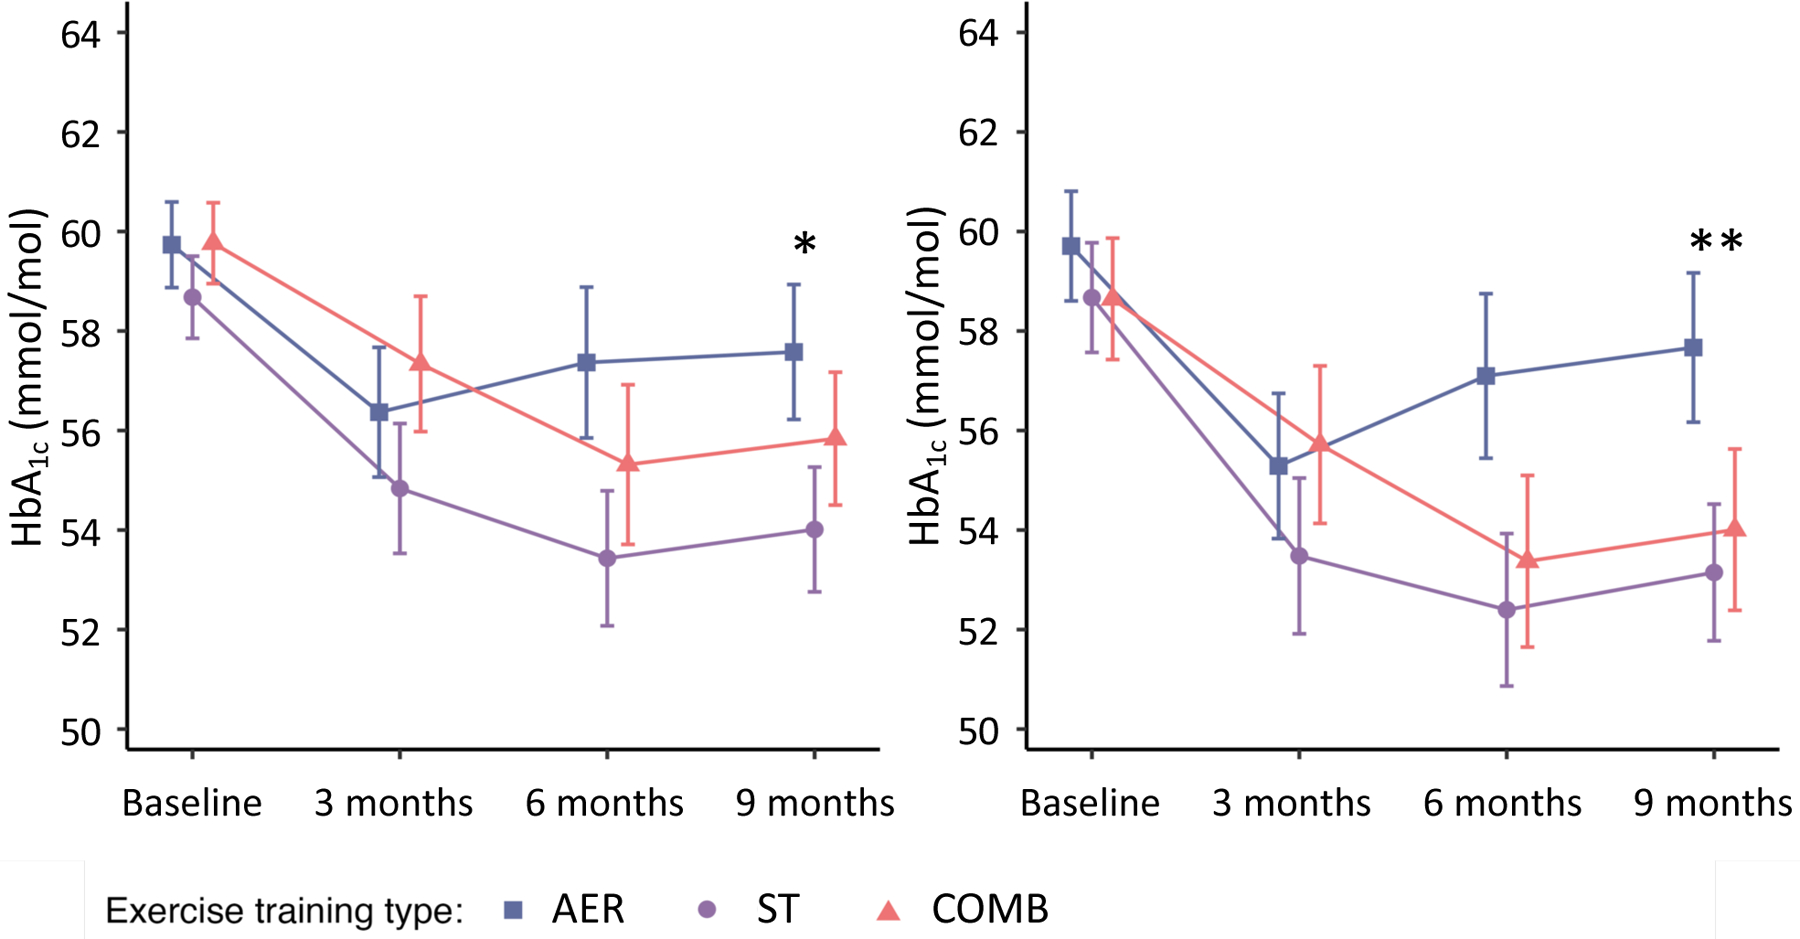
Fig. 2.

Contrast results from repeated ANOVA. Follow-up mean HbA1c levels derived from a repeated measures ANOVA for the ITT group (n=186) (a) and PP group (n=107) (b). The points correspond to the estimated means from the repeated measures ANOVA model. *p<0.05 AER vs ST, **p<0.01 AER vs ST. The table within each plot shows the results of the pairwise comparisons. Error bars represent SEs
