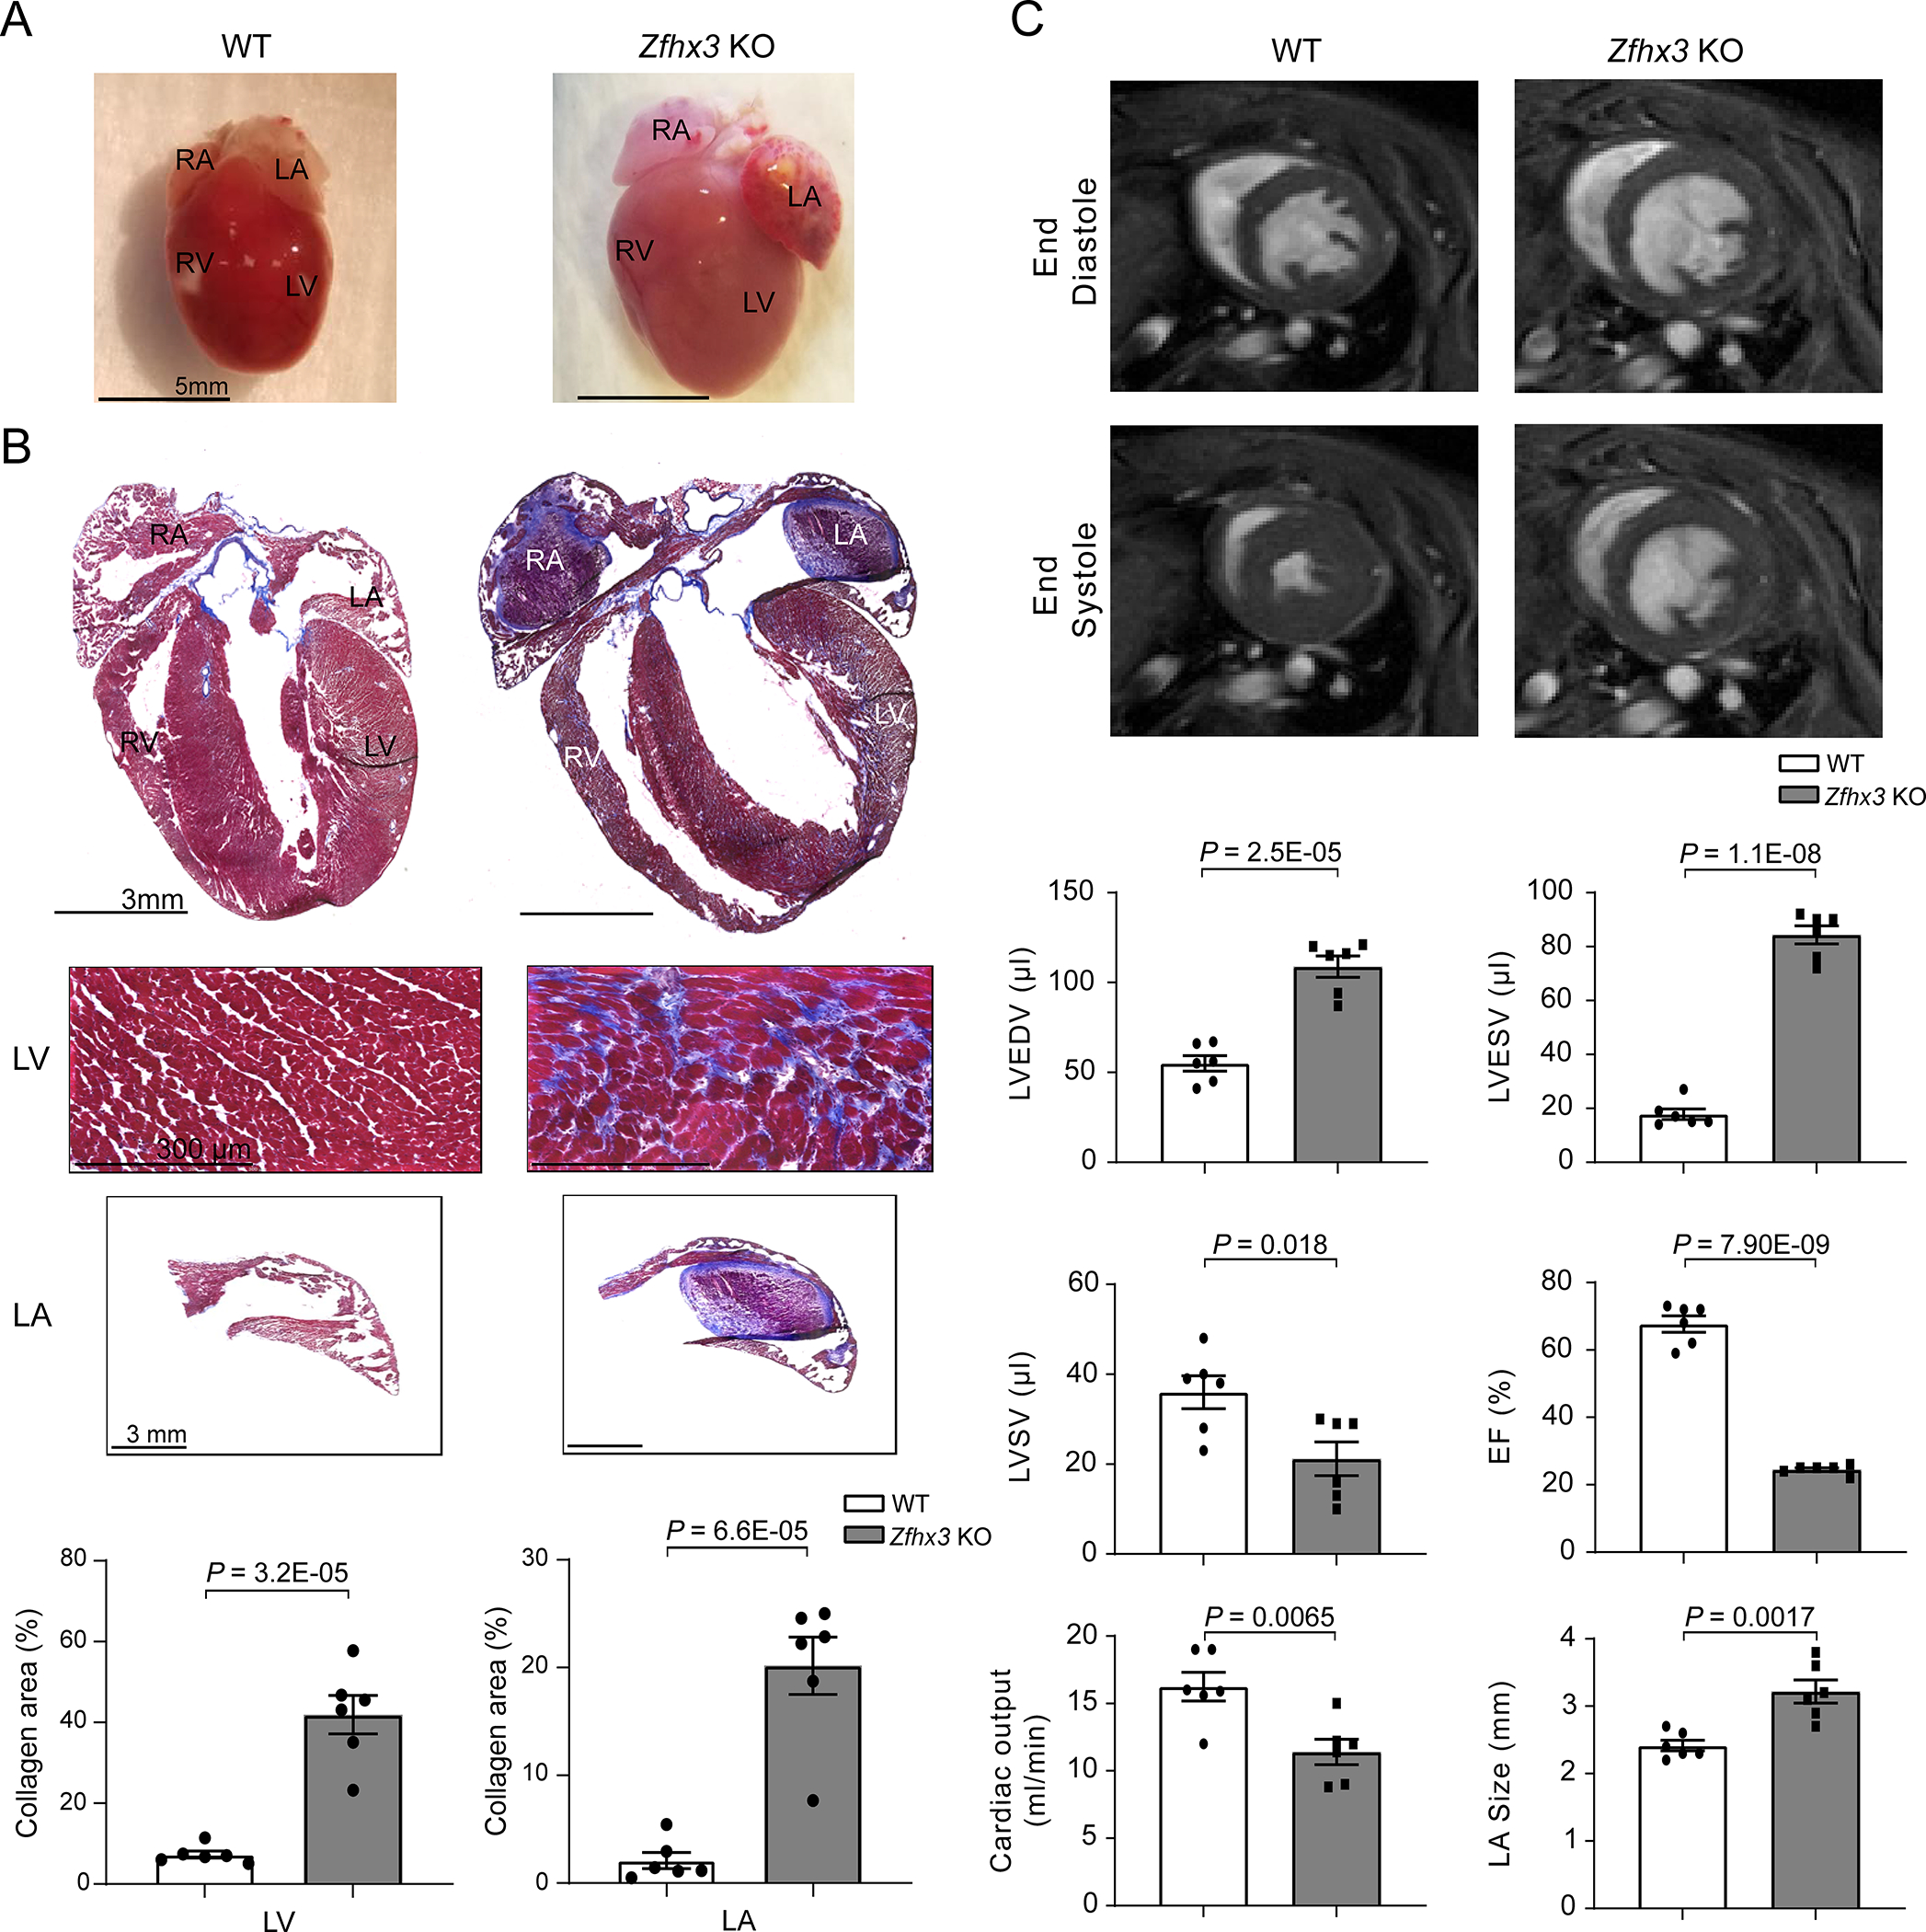
Figure 7. 9-month-old Zfhx3 KO mice have dilated cardiomyopathy and atrial thrombus.

A. Representative gross heart size in WT (left) and Zfhx3 KO (right) mice. B. Representative Masson’s trichrome staining of whole hearts, WT (top left) and Zfhx3 KO mice (top right), and heart sections from LV (top) and LA (bottom). Bar graph shows quantification of left ventricular and left atrial fibrotic areas in histological sections. n = 6 samples per genotype. C. Representative left ventricular end- diastolic (top) and systolic (bottom) frames of short axis myocardium slices for WT (left) and Zfhx3 KO (right). Quantitative comparison (bottom) of left ventricular end- diastolic volume (LVEDV), left ventricular end systolic volume (LVESV), left ventricular stroke volume (LVSV), ejection fraction (EF), and cardiac output, and left atrial (LA) size between WT and Zfhx3 KO mice. n = 6 per genotype. LV indicates left ventricle; RV, right ventricle; LA, left atrium; RA, right atrium. Data are mean ± s.e.m. P values are indicated. Groups were compared using unpaired t tests
