
Figure 4.
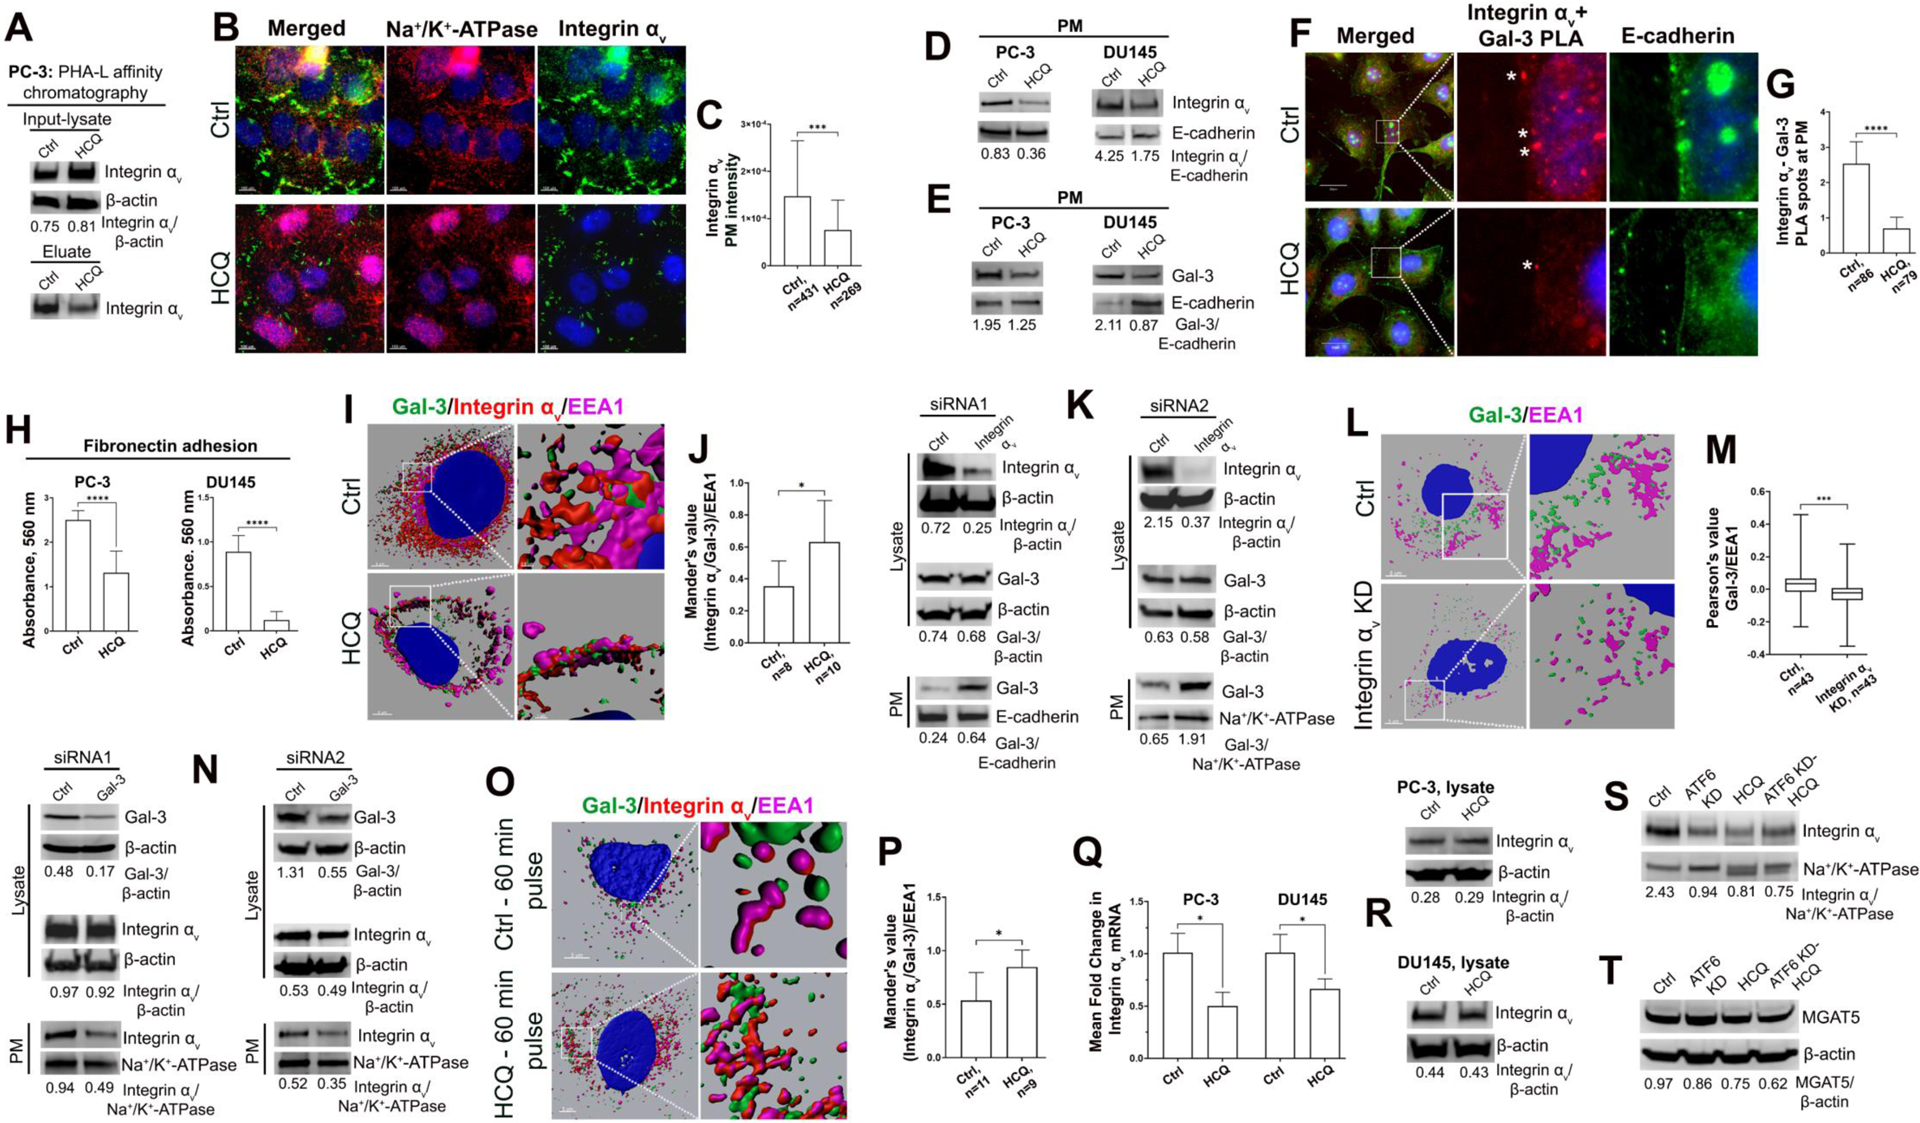
HCQ-induced redistribution of Integrin αv and Gal-3. (A) PHA-L lectin affinity chromatography of the lysate samples from control and HCQ-treated PC-3 cells. Integrin αv W-B of the input (top panel) and eluate (bottom panel). The input was normalized by β-actin and eluate by total protein concentration. (B) Representative images of PC-3 cells IF co-staining of Integrin αv (green) and Na+/K+-ATPase (red) in control and HCQ-treated cells; bars, 100 μm. (C) Quantification of Integrin αv IF intensity at PM in cells from B; Mann Whitney test. (D, E) Integrin αv (D) and Gal-3 (E) W-B of the PM samples from control and HCQ-treated PC-3 and DU145 cells. (F) PLA in control and HCQ-treated PC-3 cells, using Ms-anti-Gal-3 and Rb-anti-Integrin αv, and co-stained with Gt-anti-E-cadherin (green); bars, 20 μm. Asterisks indicate PLA-specific red spots at PM. (G) Quantification of PLA spots at PM per cell in samples from F; unpaired t test. (H) Adhesion of PC-3 and DU145 cells (control and HCQ-treated) to polystyrene microtiter plates coated with fibronectin; Mann Whitney test. (I) Representative reconstructions of the distribution of Gal-3 (green), Integrin αv (red), and early endosomal marker EEA1 (magenta) in control and HCQ-treated PC-3 cells. Z-stack images were collected, and a 3D image projection was created using Imaris for visualization; bars, 5 μm. (J) Mander’s coefficient of colocalization for Gal-3 and Integrin αv merged spots with EEA1. Unpaired t test. (K) W-B analysis of PC-3 cells treated with two different combinations of Integrin αv siRNAs. Lysate samples were tested for Integrin αv (top peanel) and Gal-3 (middle panel); PM samples were tested for Gal-3 (bottom panel). (L) Representative reconstructions of Gal-3 (green) and EEA1 (magenta) distribution in control and Integrin αv KD PC-3 cells; bars, 5 μm. (M) PCC between Gal-3 and EEA1; Mann Whitney test. (N) W-B analysis of PC-3 cells treated with two different combinations of Gal-3 siRNAs. Lysate samples were tested for Gal-3 (top panel) and Integrin αv (middle panel); PM samples were tested for Integrin αv (bottom panel). (O) Representative reconstructions of pulse-chase endocytosis experiment. Integrin αv Ab (red) was internalized by control or HCQ-treated PC-3 cells, which were then stained for Gal-3 (green) and EEA1 (magenta); bars, 5 μm. (P) Mander’s coefficient of colocalization for Gal-3 and Integrin αv merged spots with EEA1; Mann Whitney test. (Q) RT-qPCR analysis of Integrin αv mRNA in control and HCQ-treated PC-3 and DU145, calculated using the 2−ΔΔCT method with GAPDH as the reference gene. Results are the means of three independent experiments performed in triplicate. (R) Integrin αv W-B of the lysate samples from PC-3 and DU145 cells: control and treated with HCQ. (S, T) Integrin αv (S) and MGAT5 (T) W-B of the PM samples from PC-3 cells: control and ATF6 KD treated with HCQ. For W-B data: E-cadherin and Na+/K+-ATPase are the loading controls for PM samples, and lysates were normalized by β-actin. For all statistics: median ± SD, ***p<0.001, ****p<0.0001, *p<0.05; n indicates the number of cells. All data presented are representative of at least three independent experiments.