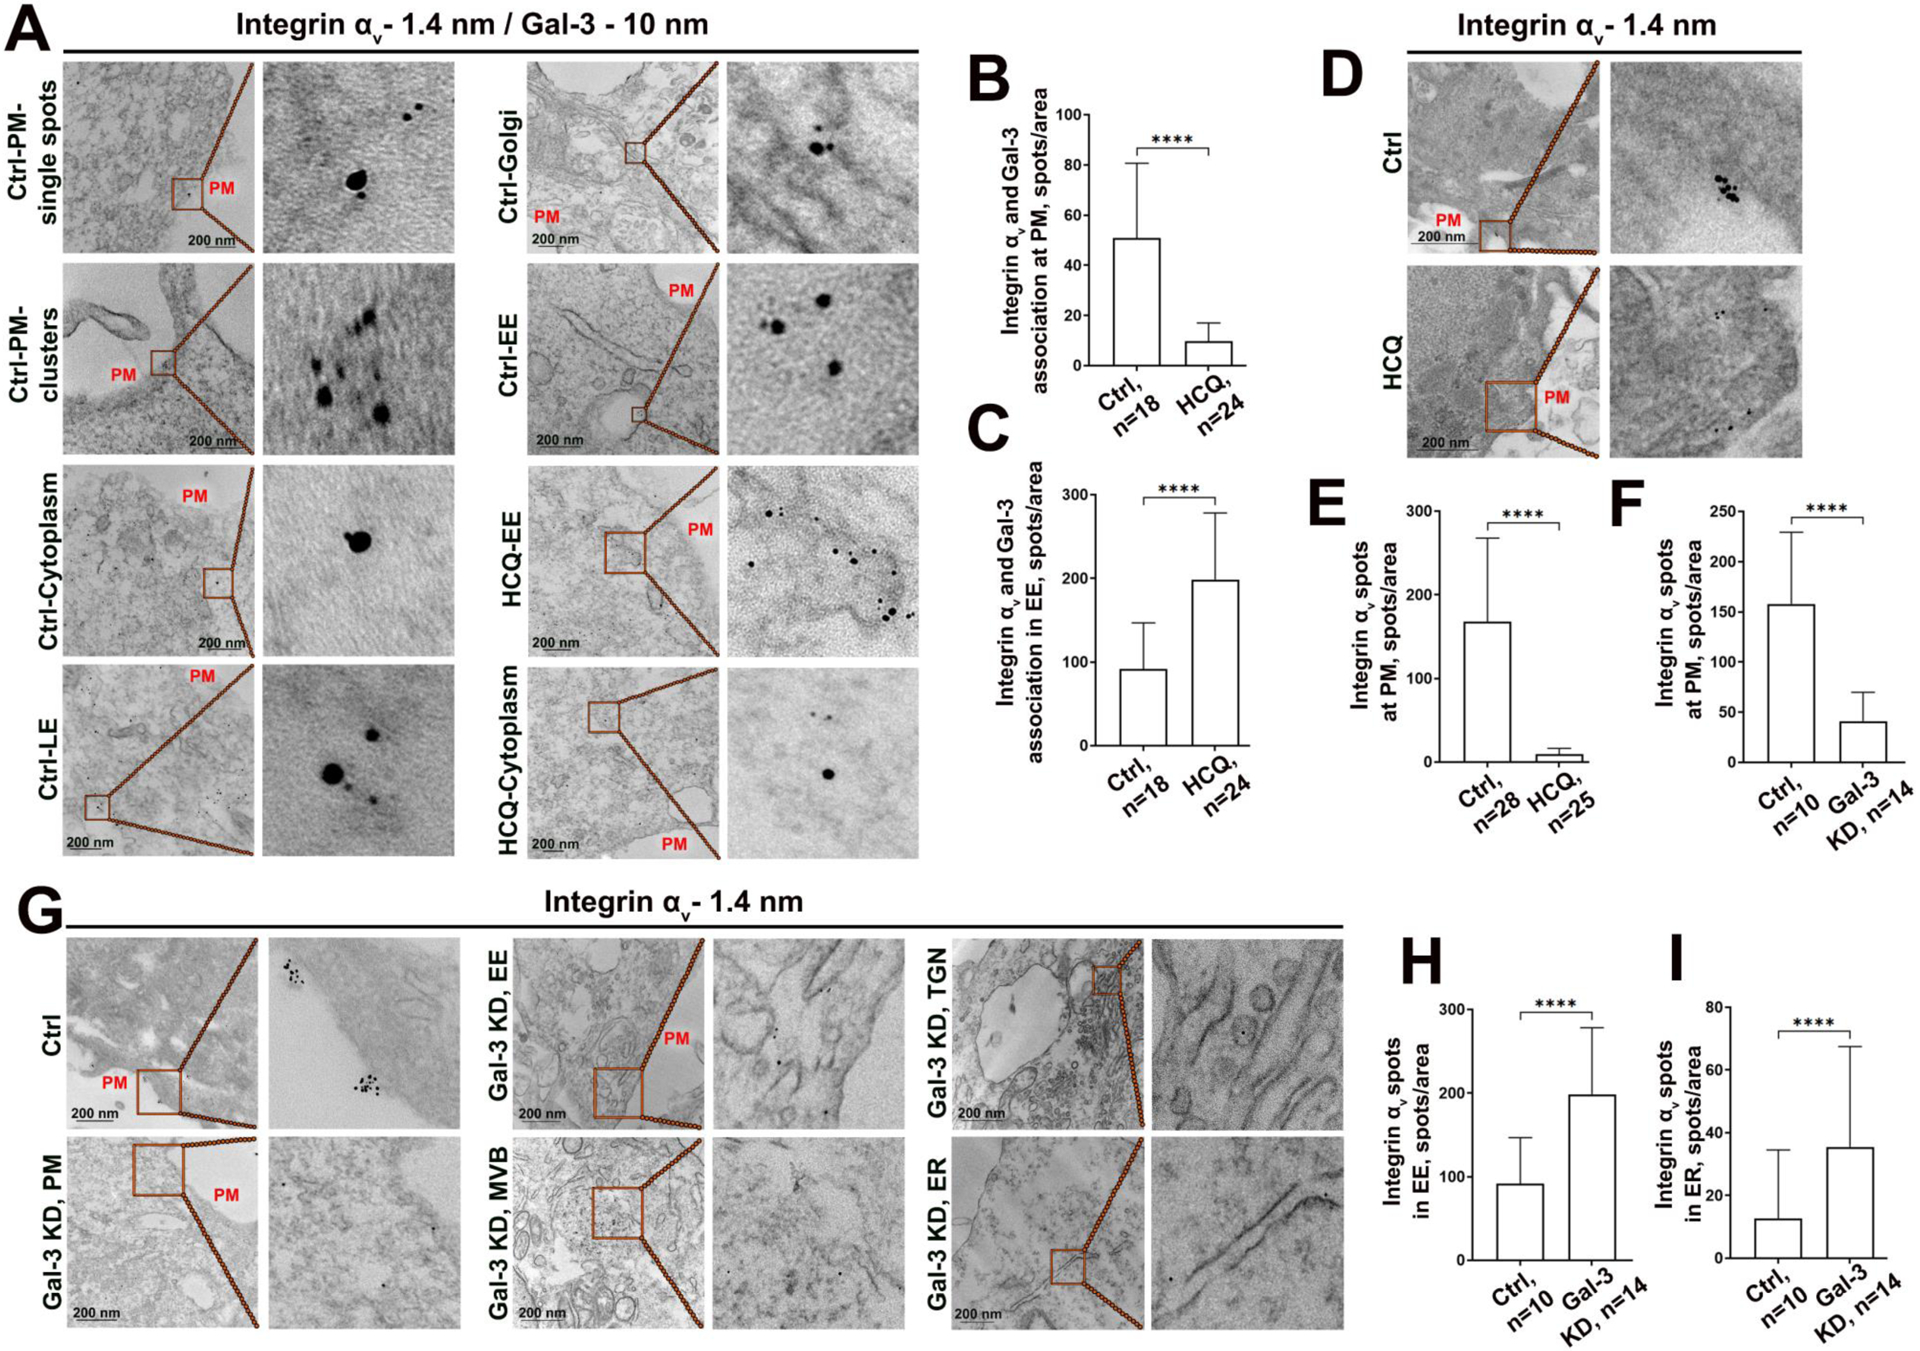
Figure 5.

Analysis of Integrin αv and Gal-3 distribution using immunogold EM. (A) Representative micrographs of double pre-embedding immunogold EM analyses of Integrin αv and Gal-3 in PC-3 cells using Abs conjugated to 1.4-nm and 10-nm gold particles, respectively. Cells were treated with 50 μM HCQ or a proper amount of water (Ctrl). The two upper left panels (Ctrl-PM) demonstrate the merged Integrin αv-Gal-3 spots at PM: single or clusters. Others indicate their distribution in the cytoplasm, late endosomes (LE), Golgi, and early endosomes (EE). (B, C) Quantification of merged Integrin αv-Gal-3 spots at PM (B) and in EE (C) in cells from A per area in μm2. (D) Representative micrographs of single pre-embedding immunogold EM analyses of Integrin αv in PC-3 cells treated with 50 μM HCQ for 72 h or an appropriate amount of water. (E) Quantification of Integrin αv spots at PM from cells in D. (F) Quantification of Integrin αv spots at PM from control and Gal-3 KD PC-3 cells. (G) Representative micrographs of single pre-embedding immunogold EM analyses of Integrin αv in PC-3 cells treated with control or Gal-3 siRNAs; MVB, multivesicular bodies; TGN, trans-Golgi network; ER, endoplasmic reticulum. (H, I) Quantification of Integrin αv spots in EE and ER, respectively, in cells from G. For all graphs, n is the number of cells, bars 200 nm. Mann Whitney test for all graphs; ****p<0.0001, median ± SD.
