
Figure 6.
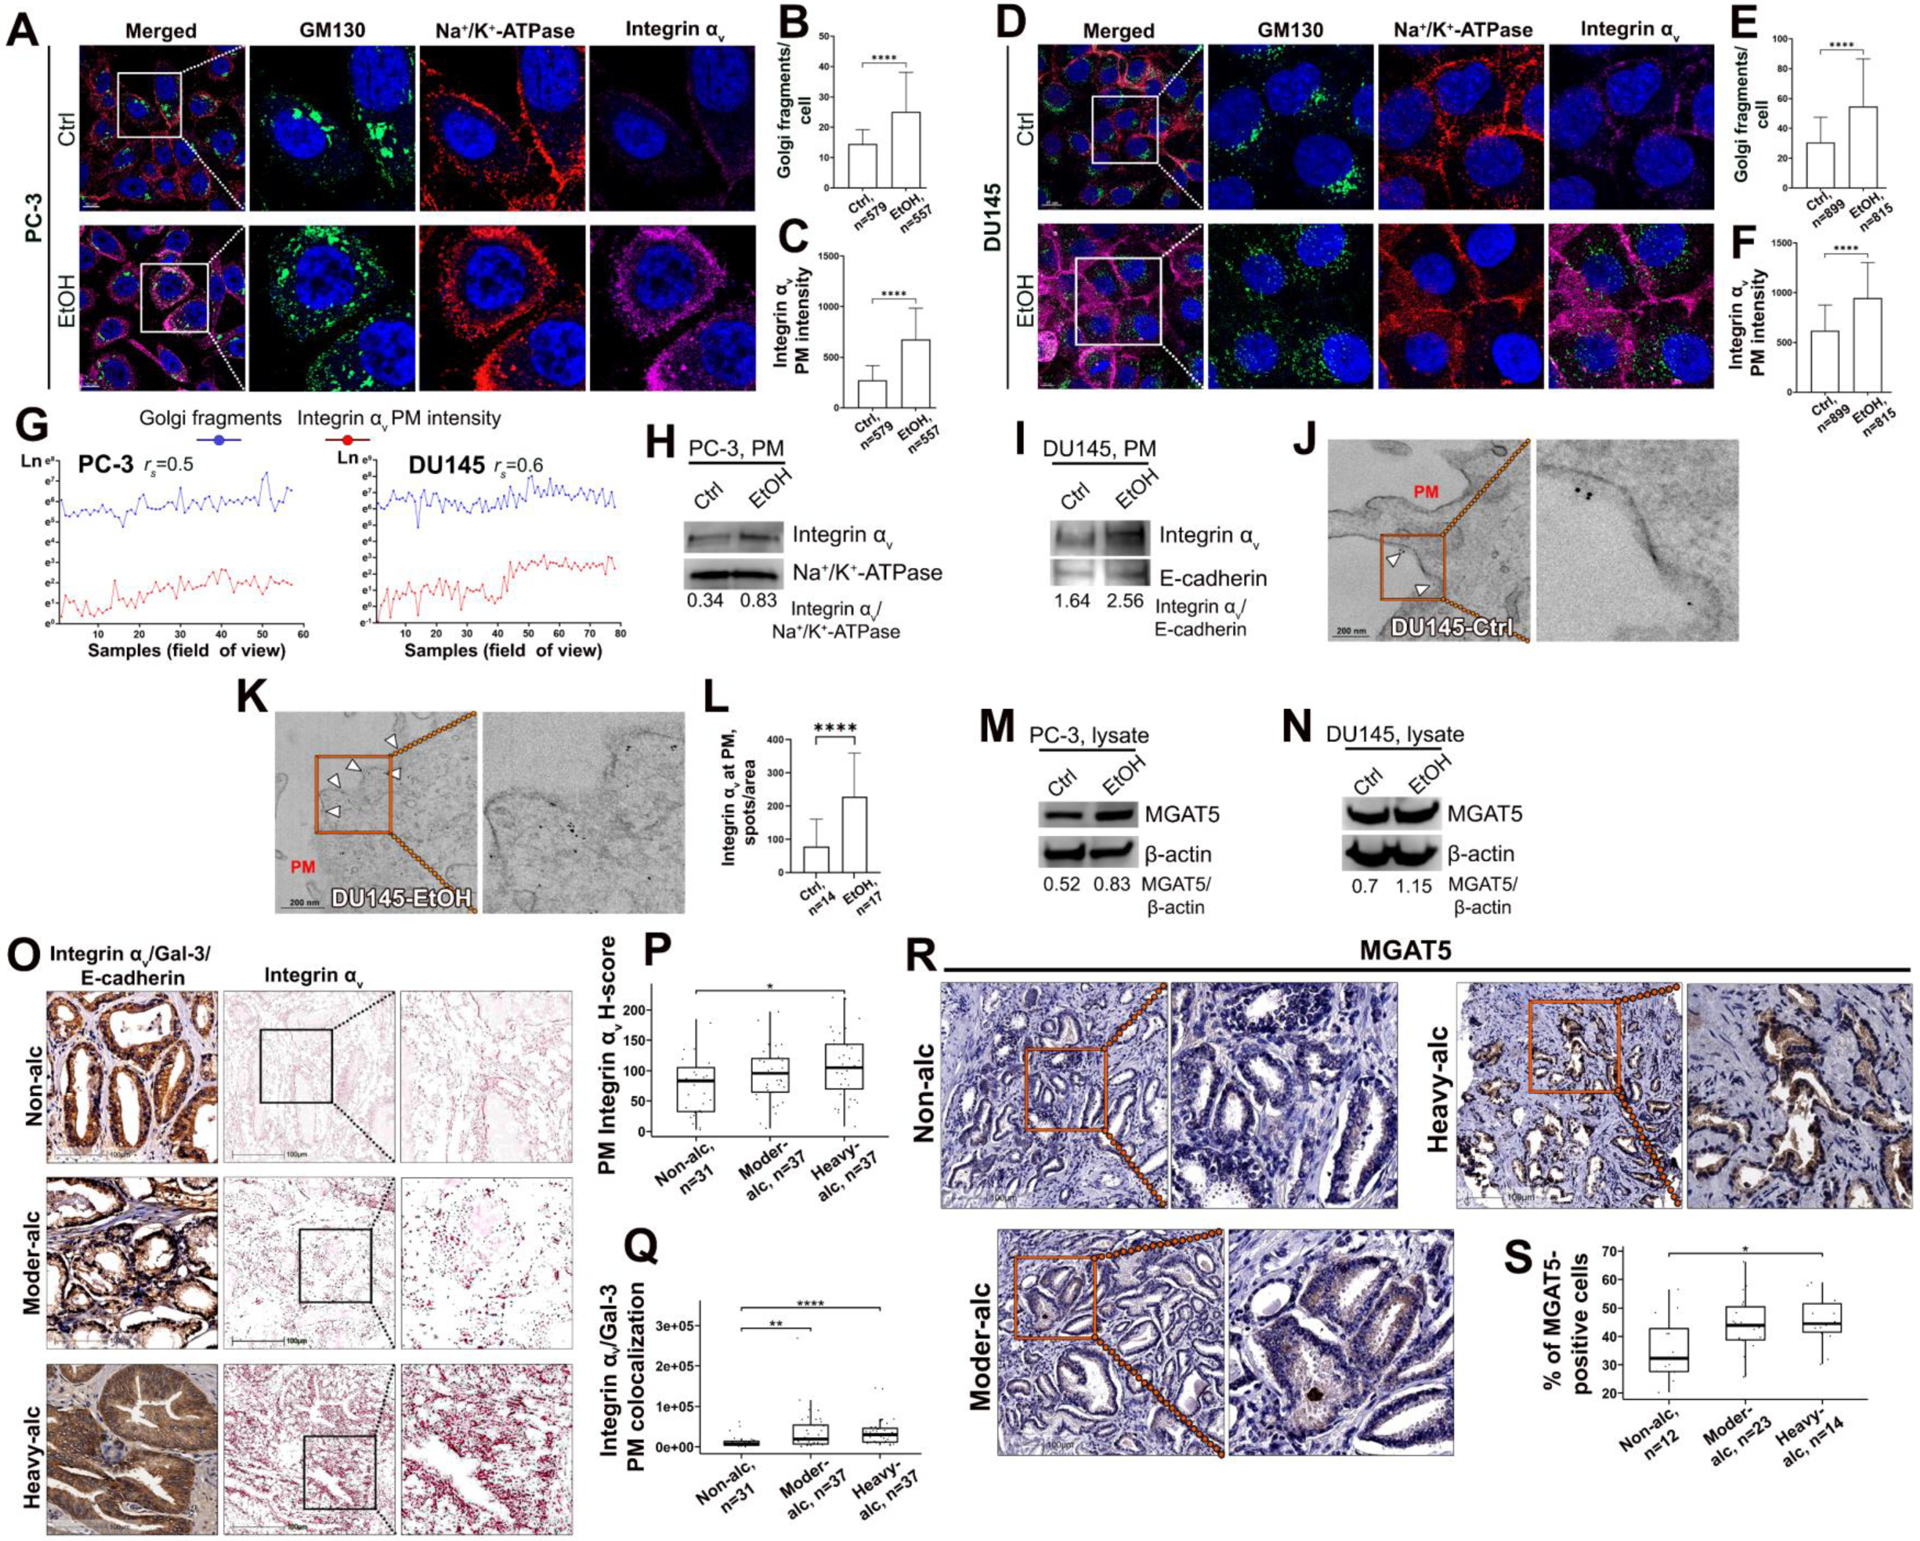
The impact of alcohol on Golgi morphology and expression of Integrin αv and MGAT5. (A-F) Representative IF images of Golgi (GM130, green), PM (Na+/K+-ATPase, red), and Integrin αv (magenta) in PC-3 (A) and DU145 (D) cells treated with 11.5 μM ethanol (EtOH) or isocaloric amount of media (Ctrl) for 72 hours; bars, 10 μm. B and E: quantification of the number of Golgi fragments per cell from images in A and D, respectively; C and F: quantification of Integrin αv integrated fluorescence intensity at PM from images in A and D, respectively. Mann Whitney test for B, E, and F, unpaired t test for C. For B, C, E, and F, n indicates the number of cells. (G) Correlation analysis between the number of Golgi spots (blue) and PM Integrin αv (red) counted as the average for each parameter in the cells from one field of view. Spearman Rank Correlation Coefficient, rs; p<0.0001. (H, I) Integrin αv W-B of the PM samples from the cells in A and D, respectively; Na+/K+-ATPase and E-cadherin are loading controls. (J, K) Representative micrographs of single pre-embedding immunogold EM analyses of Integrin αv in control (J) and EtOH-treated (K) DU145 cells. Arrowheads indicate Integrin αv-specific spots on PM. (L) Quantification of Integrin αv spots per area of PM (in μm2) in cells from J and K; Mann Whitney test. (M, N) MGAT5 W-B of the lysate samples from the cells in A and D, respectively; β-actin is a loading control. (O) Triple IHC staining of Integrin αv (red, deconvoluted in the middle), Gal-3 (green), and E-cadherin (brown) in tumor tissues from PCa patients: non-alcoholic or consuming alcohol at a moderate or high level; bars, 100 μm. (P, Q) Quantification of Integrin αv PM H-score (P) and colocalization of Integrin αv with Gal-3 at the PM (Q) from the samples in O. For P: Tukey Method, p-adjusted using Benjamini-Hochberg. For Q: Dunn Test (1964) Kruskal-Wallis multiple comparisons; n indicates the number of samples. (R) MGAT5 IHC (brown) in tumor tissues from PCa patients: non-alcoholic or consuming alcohol at the moderate or high level; bars, 100 μm. (S) Quantification of the percent of MGAT5-positive cells from the samples in R. Tukey Method, p-adjusted using Benjamini-Hochberg. For all statistics: median ± SD, ****p<0.0001, **p<0.005, *p<0.05. All data presented are representative of at least three independent experiments.