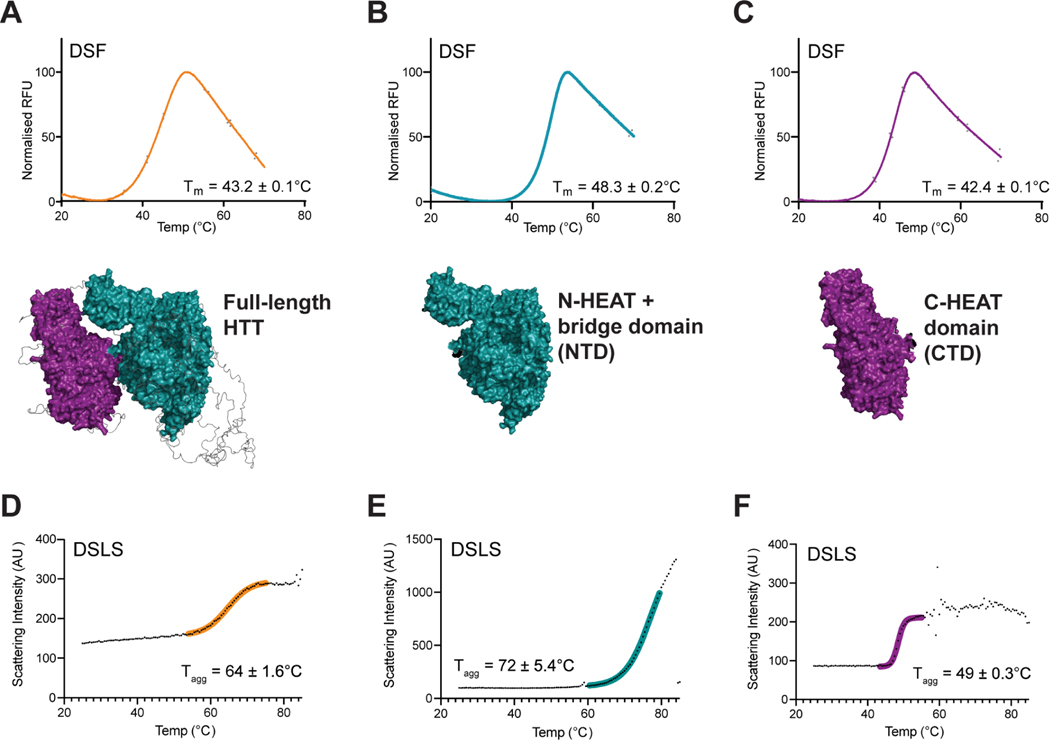
Figure 2: NTD and CTD subdomains of HTT have good biophysical properties.
A-C, DSF profiles and calculated melting temperature () values for full-length HTT (orange) vs NTD (teal) and CTD (magenta). Melting temperatures were determined from the inflection point of curves obtained by fitting the data to the Boltzmann sigmoidal function. D-F, DSLS profiles of full-length HTT (orange) vs. NTD (teal) and CTD (magenta) showing calculated aggregation temperature ().

