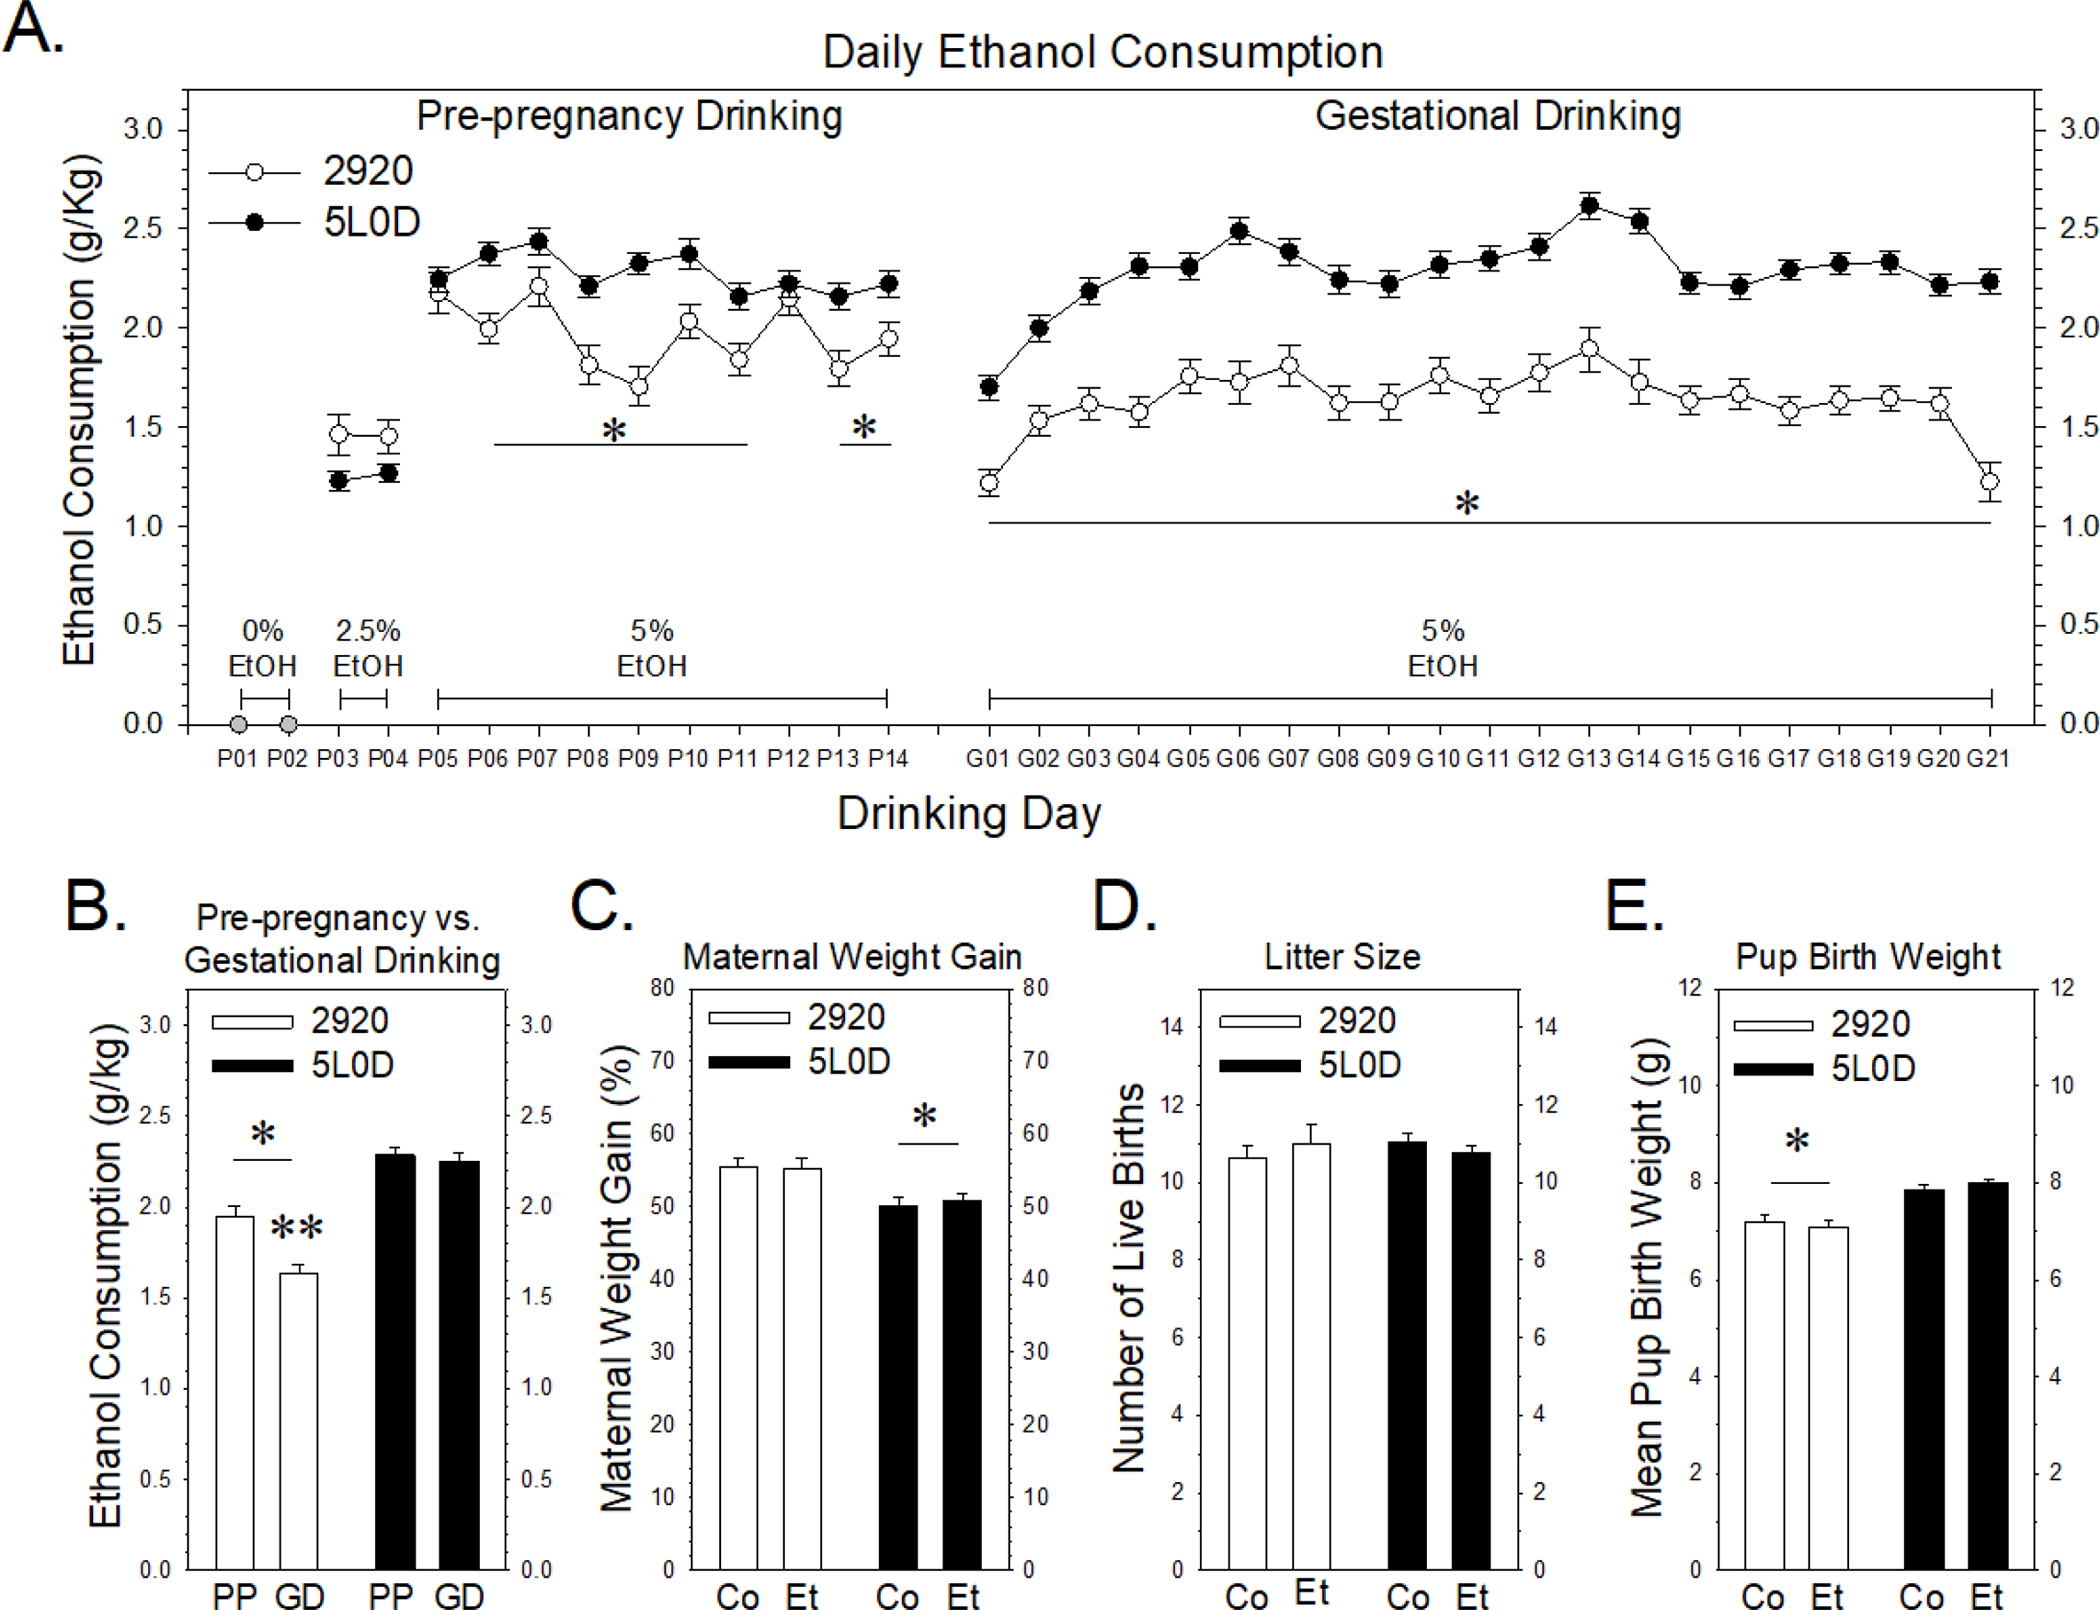
FIGURE 1. Effects of 2920 and 5L0D diets on ethanol consumption before and during pregnancy and on rat dam weight gain, litter size and pup birth weight.

Data points or graph bars in Figures 1A and 1B represent the mean ± SEM grams of ethanol consumed / kg body weight of thirty-seven 2920 females (white) or eighty-four 5L0D females (black). 1A: Pre-pregnancy ethanol consumption. A two-way analysis of variance (ANOVA) revealed a significant interaction between diet and drinking day (F9,1185 = 2.28, p = 0.015). The asterisks denote pre-pregnancy drinking days when 5% ethanol consumption by 2920 females was significantly less compared to 5L0D females (Holm-Sidak post-hoc tests: t values > 2.0, p < 0.045). Gestational ethanol consumption. A two-way ANOVA revealed significant main effects of diet (F1,2494 = 719, p < 0.001) and drinking day (F20,2494 = 8.79, p < 0.001). The asterisk denotes that ethanol consumption by 2920 dams was significantly less compared to 5L0D dams throughout gestation. 1B: Mean daily 5% ethanol consumption prior to and during pregnancy. “PP” denotes pre-pregnancy drinking days and “GD” denotes gestational drinking days. A two-way analysis of variance (ANOVA) revealed a significant interaction between diet and gestational state (F1,238 = 6.84, p = 0.009). The single asterisk denotes that ethanol consumption by 2920 rats was significantly less both before and during pregnancy (Holm-Sidak post-hoc tests: pre-pregnancy t = 4.56, p < 0.001; gestational drinking t = 8.26, p < 0.001). Further, while ethanol consumption by 5L0D rats was not different before or during pregnancy (t = 0.59, p = 0.55), ethanol consumption by 2920 rats decreased significantly during pregnancy, denoted by the double asterisk (t = 3.53, p < 0.001). 1C: Maternal weight gain during pregnancy, expressed as a percentage increase in weight above weight at breeding. In Figures 1C – 1E, “Co” denotes the saccharin (0% ethanol) group and “Et” denotes the 5% ethanol treatment group. Data bars in Figures 1C - 1E represent the mean ± SEM percent change in weight gain (1C), litter sizes (1D) and pup birth weights (1E) of thirty-eight saccharin control 2920 dams and thirty-seven 5% ethanol 2920 dams (white bars) and eighty five saccharin control 5L0D dams and eighty-four 5% ethanol 5L0D dams (black bars). A two-way ANOVA revealed significant main effect of diet on weight gain (F1,240 = 14.4, p < 0.001), with 5L0D dams gaining significantly less weight, denoted by the asterisk, than 2920 dams. Prenatal treatment did not affect maternal weight gain (F1,240 = 0.016, p =0.899). 1D: Offspring litter size, expressed as the number of live births per litter. A two-way ANOVA revealed no significant effects of either diet (F1,240 = 0.064, p = 0.800) or prenatal treatment (F1,240 = 0.0188, p =0.891). 1E: Mean offspring birth weight, expressed in grams, based on total litter weight divided by litter size. A two-way ANOVA revealed significant main effect of diet on pup birth weight (F1,240 = 43.3, p < 0.001), with 2920 dams gaining significantly less weight, denoted by the asterisk, than 5L0D pups. Prenatal treatment did not affect pup birth weight gain (F1,240 = 0.018, p =0.892).
