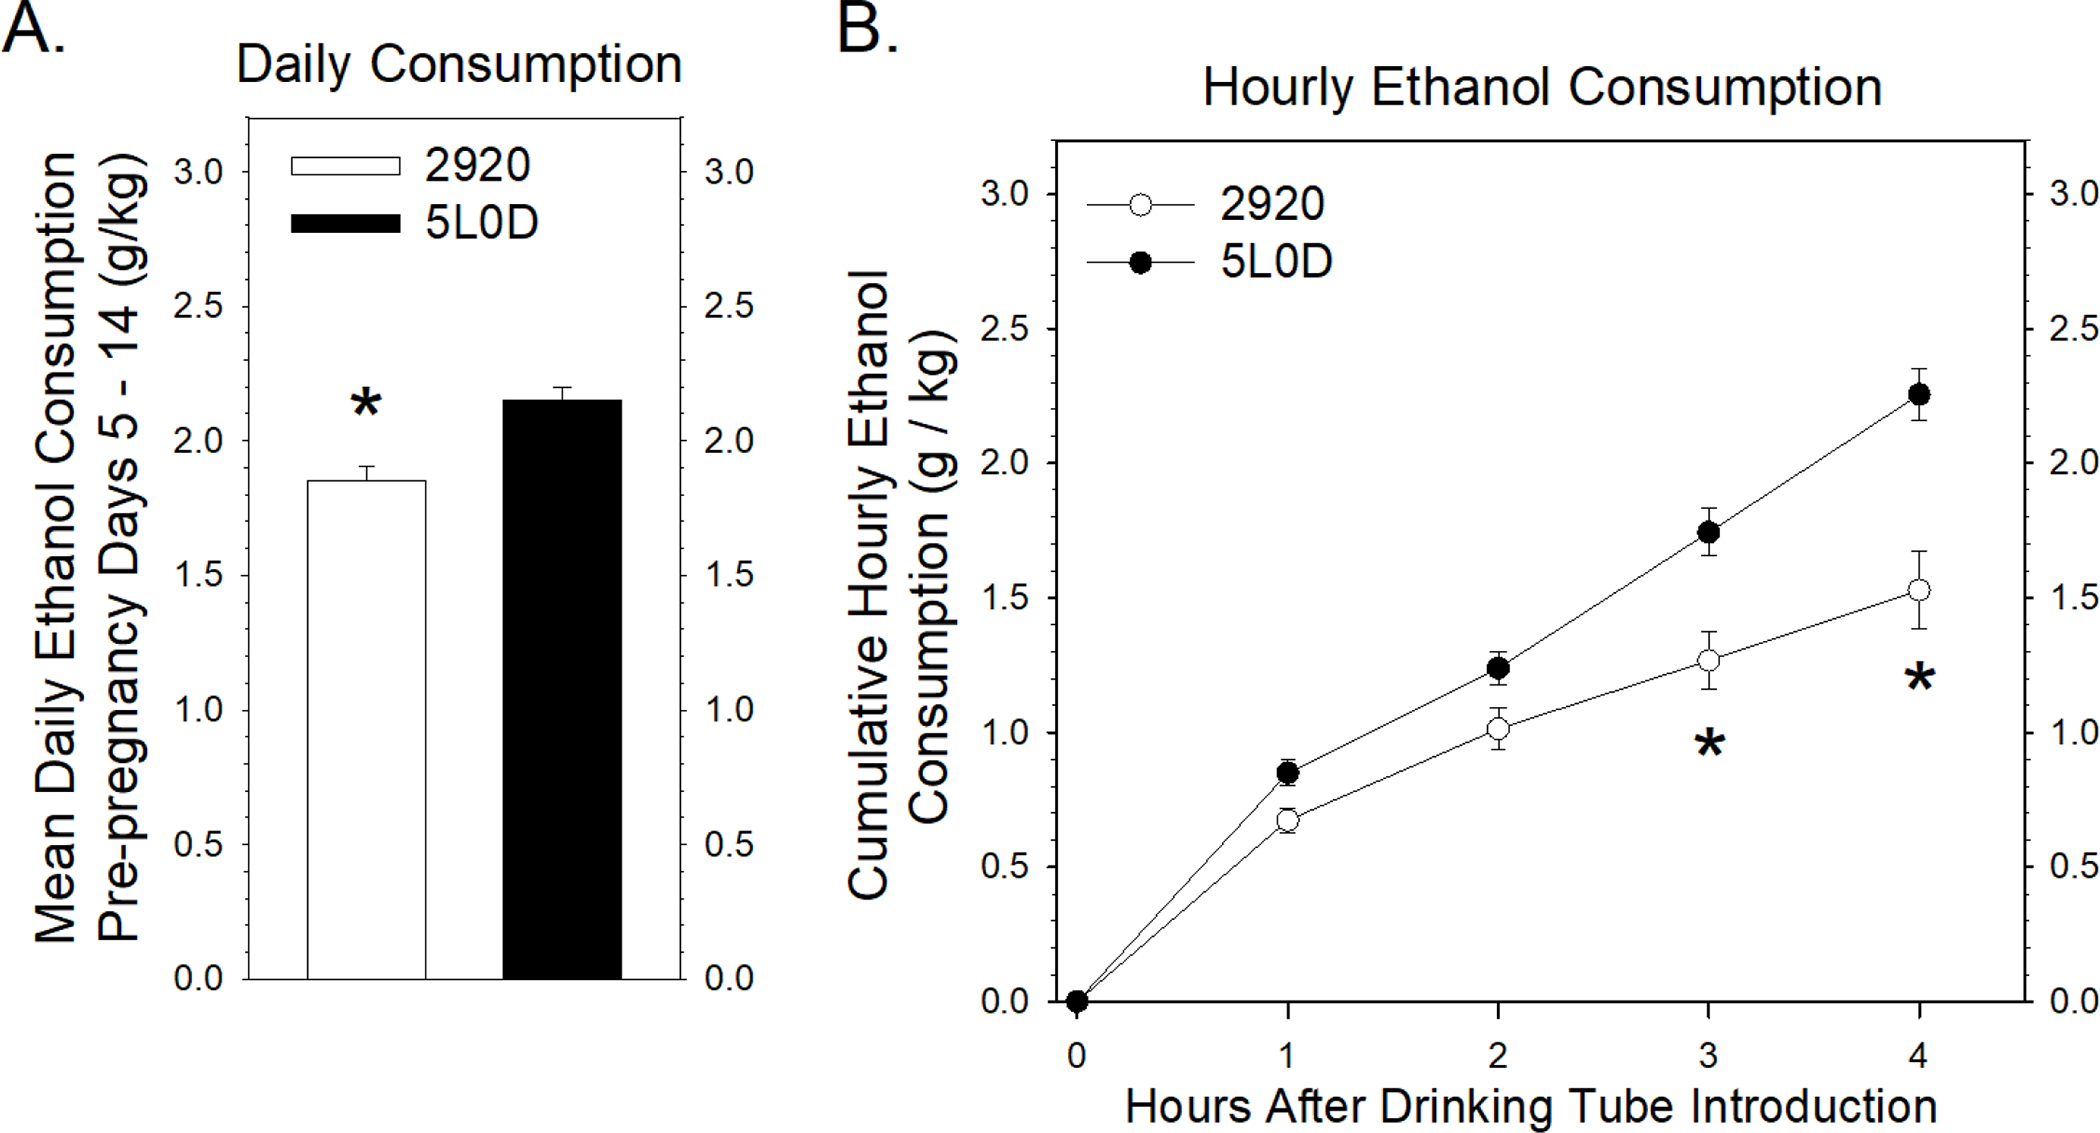
FIGURE 2. Impact of the 2920 and 5L0D diets on hourly ethanol consumption.

2A: Mean daily 5% ethanol consumption prior to pregnancy. Data points represent the mean ± SEM grams of daily 5% ethanol consumed / kg body weight of 18 pairs of female rats. The asterisk denotes that the 2920 females consumed less ethanol compared to 5L0D females (Student’s two-tailed t-test: t = −4.22 with 34 degrees of freedom; p < 0.001). 2B: Hourly 5% ethanol consumption prior to pregnancy. A two-way ANOVA revealed a significant interaction between the cumulative amount of ethanol consumed and time since the introduction of the drinking tubes (F3,136 = 4.07, p = 0.008). A post-hoc Holm-Sidak test indicated no significant differences in cumulative ethanol consumption after one hour (t = 1.40, p = 0.163) or two hours (t = 1.79, p = 0.075), but significant decreases, denoted by asterisks, in cumulative ethanol consumption by 2920 females compared to 5L0D females after three hours (t = 3.78, p < 0.001) and four hours (t = 5.78, p < 0.001) of ethanol consumption.
