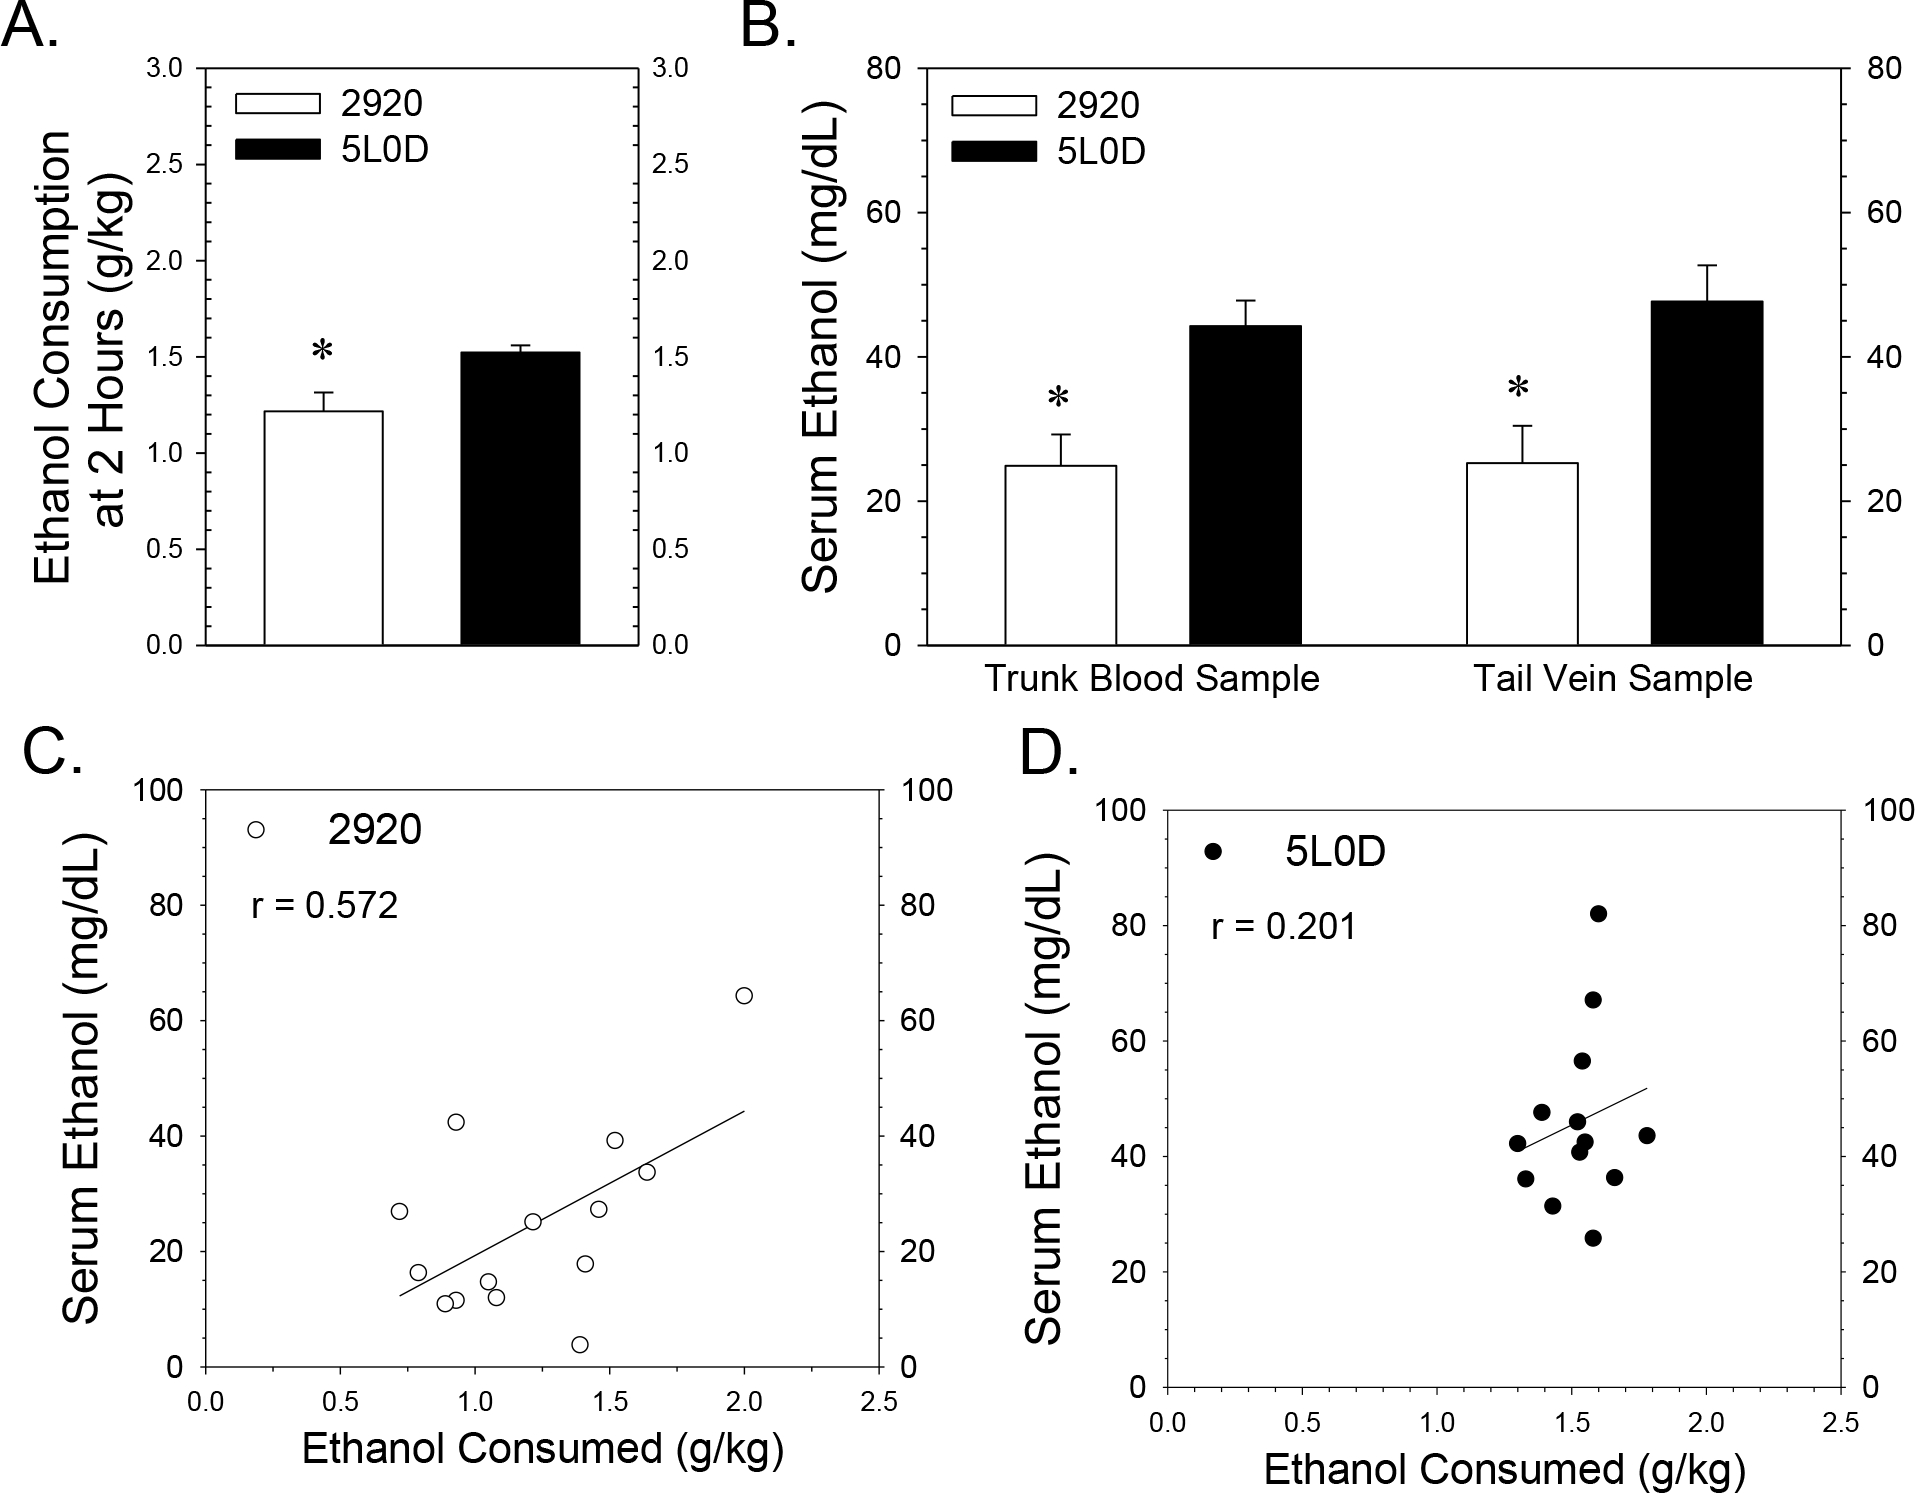
FIGURE 3. Effects of the 2920 and 5L0D diets on ethanol consumption and serum ethanol concentrations in rat dams two hours after the introduction of the drinking tube.

Data points or graph bars in Figure 3 represent the mean ± SEM grams of ethanol consumed / kg body or serum ethanol concentration from fourteen 2920 dams (white) or thirteen 5L0D dams (black). 3A: Mean 5% ethanol consumption two hours after the introduction of the drinking tubes on the gestational day of blood sampling pregnancy. The asterisk denotes that the 2920 dams consumed less ethanol compared to 5L0D dams at the time of blood sampling (Student’s two-tailed t-test: t = −2.83 with 25 degrees of freedom; p = 0.009). 3B: Serum ethanol concentrations from both tail vein and trunk blood samples collected two hours after the introduction of the drinking tubes. Samples were collected sequentially from tail vein and trunk blood from rat dams 110 to 120 minutes after the introduction of drinking tubes either on Gestational Days 15, 16 or 17. A two-way ANOVA revealed significant difference based on diet (F1,47 = 21.1, p < 0.001) with no significant effect of blood ethanol sample source (F1,47 = 0.174, p = 0.678) and no significant interaction between factors (F1,47 = 0.113, p = 0.738). Asterisks denote a significant decrease in serum ethanol concentration in dams consuming the 2920 dams compared to the 5L0D dams. 3C and 3D: Impact of the 2920 and 5L0D diets on the relationship between rat dam ethanol consumption and serum ethanol concentration. Tail vein and trunk blood serum ethanol concentrations were averaged for each rat dam plotted as a function of ethanol consumption data for 2920 dams (3C) and 5L0D dams (3D). The range of ethanol consumption on the 2920 diet was nearly double the range with the 5L0D diet, while the corresponding ranges in serum ethanol concentration were similar between the two diets. Pearson correlation analyses revealed a moderate but significant positive correlation (r = 0.57, p =0.032) between ethanol consumption and resulting serum ethanol levels in 2920 dams (3C), but a lower positive correlation between consumption and ethanol level (r = 0.20, p = 0.511) in 5L0D dams (3D).
