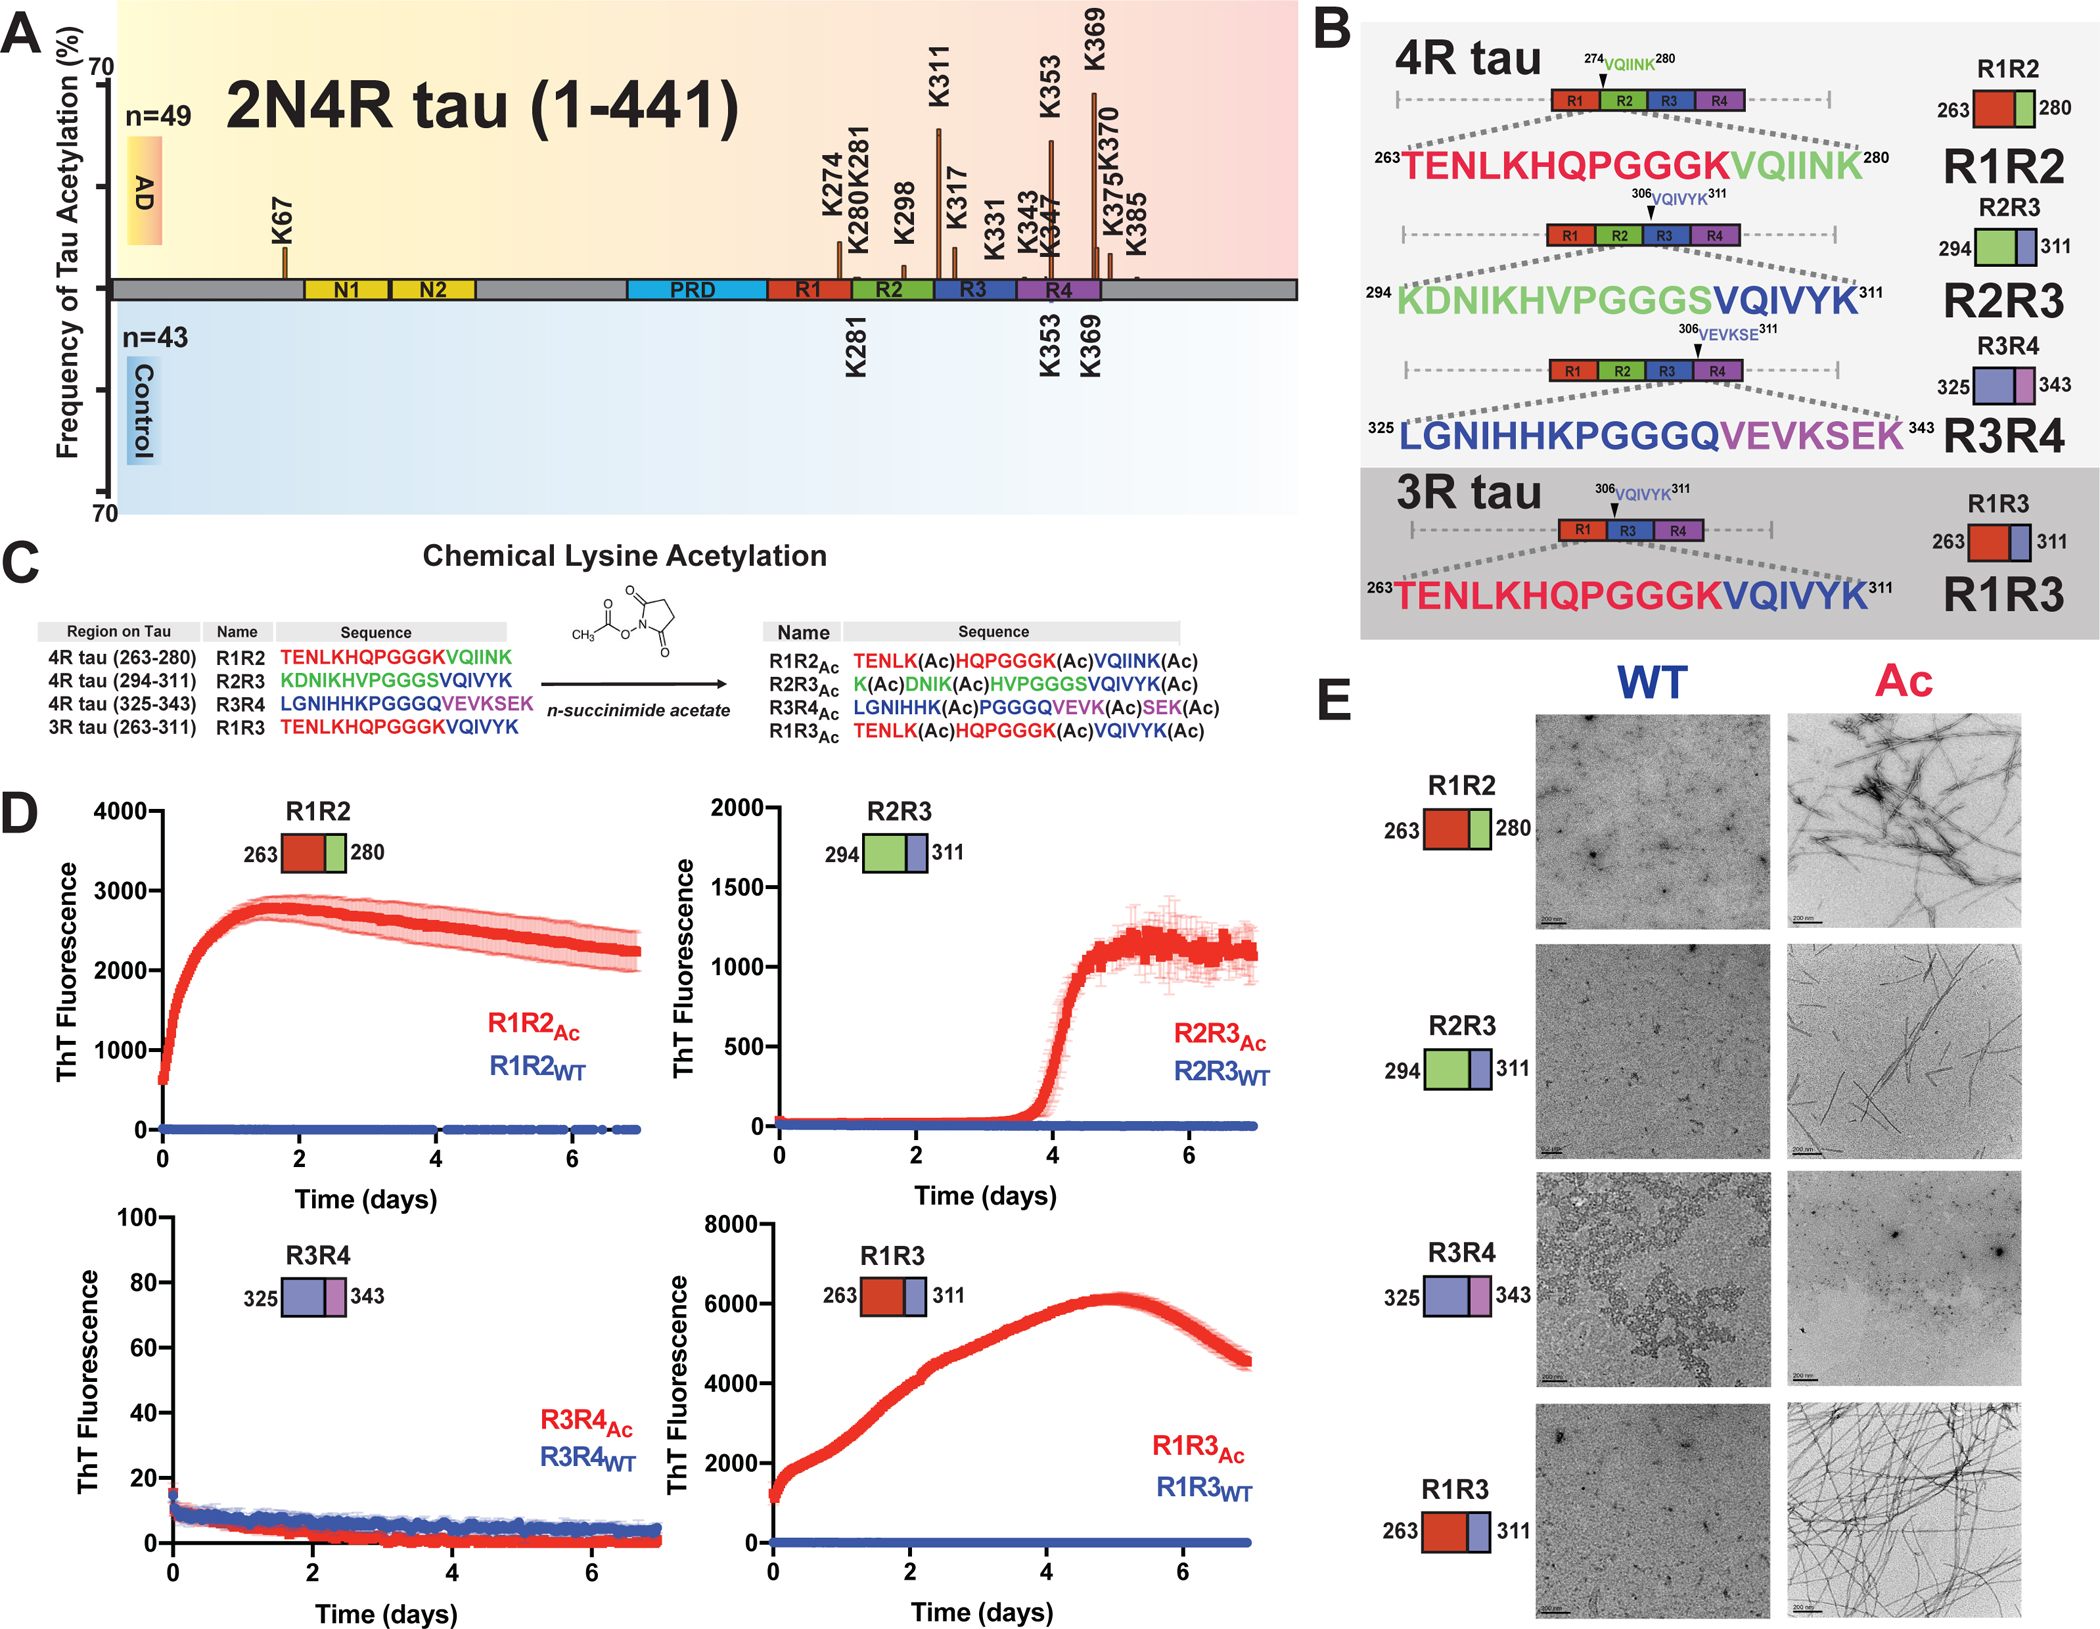
Figure 1. Chemical acetylation of lysines on amyloid motif-containing tau fragments drives fibril assembly.

A. Literature reported acetylation sites on 2N4R tau in AD and control patients; the modification frequency is noted on the y axis. N-terminal extension domains, N1 and N2, are colored in orange. Proline-rich domain (PRD) is colored in blue. Repeat domains are colored in red, blue, green and magenta for repeats 1, 2, 3 and 4, respectively. B. Schematic illustrating the four tau model peptides (R1R2, R2R3, R3R4 and R1R3). Their sequence and relative location in the repeat domain are shown. Repeat domain elements are colored as in Figure 1A. C. Schematic illustrating acetylation modification reaction with n-succinimide acetate of the tau peptides. D. ThT fluorescence aggregation assay of acetylated peptides (red) and their corresponding non-acetylated controls (blue). Aggregation experiments were performed in triplicate and the averages are shown with standard deviation. The data were fit to a non-linear regression model fitting in GraphPad Prism to estimate an average t1/2max with a standard deviation. E. TEM images of acetylation modified peptides (red, right column) and their corresponding non-modified controls (blue, left column). Scale bars indicate 0.2 μm.
