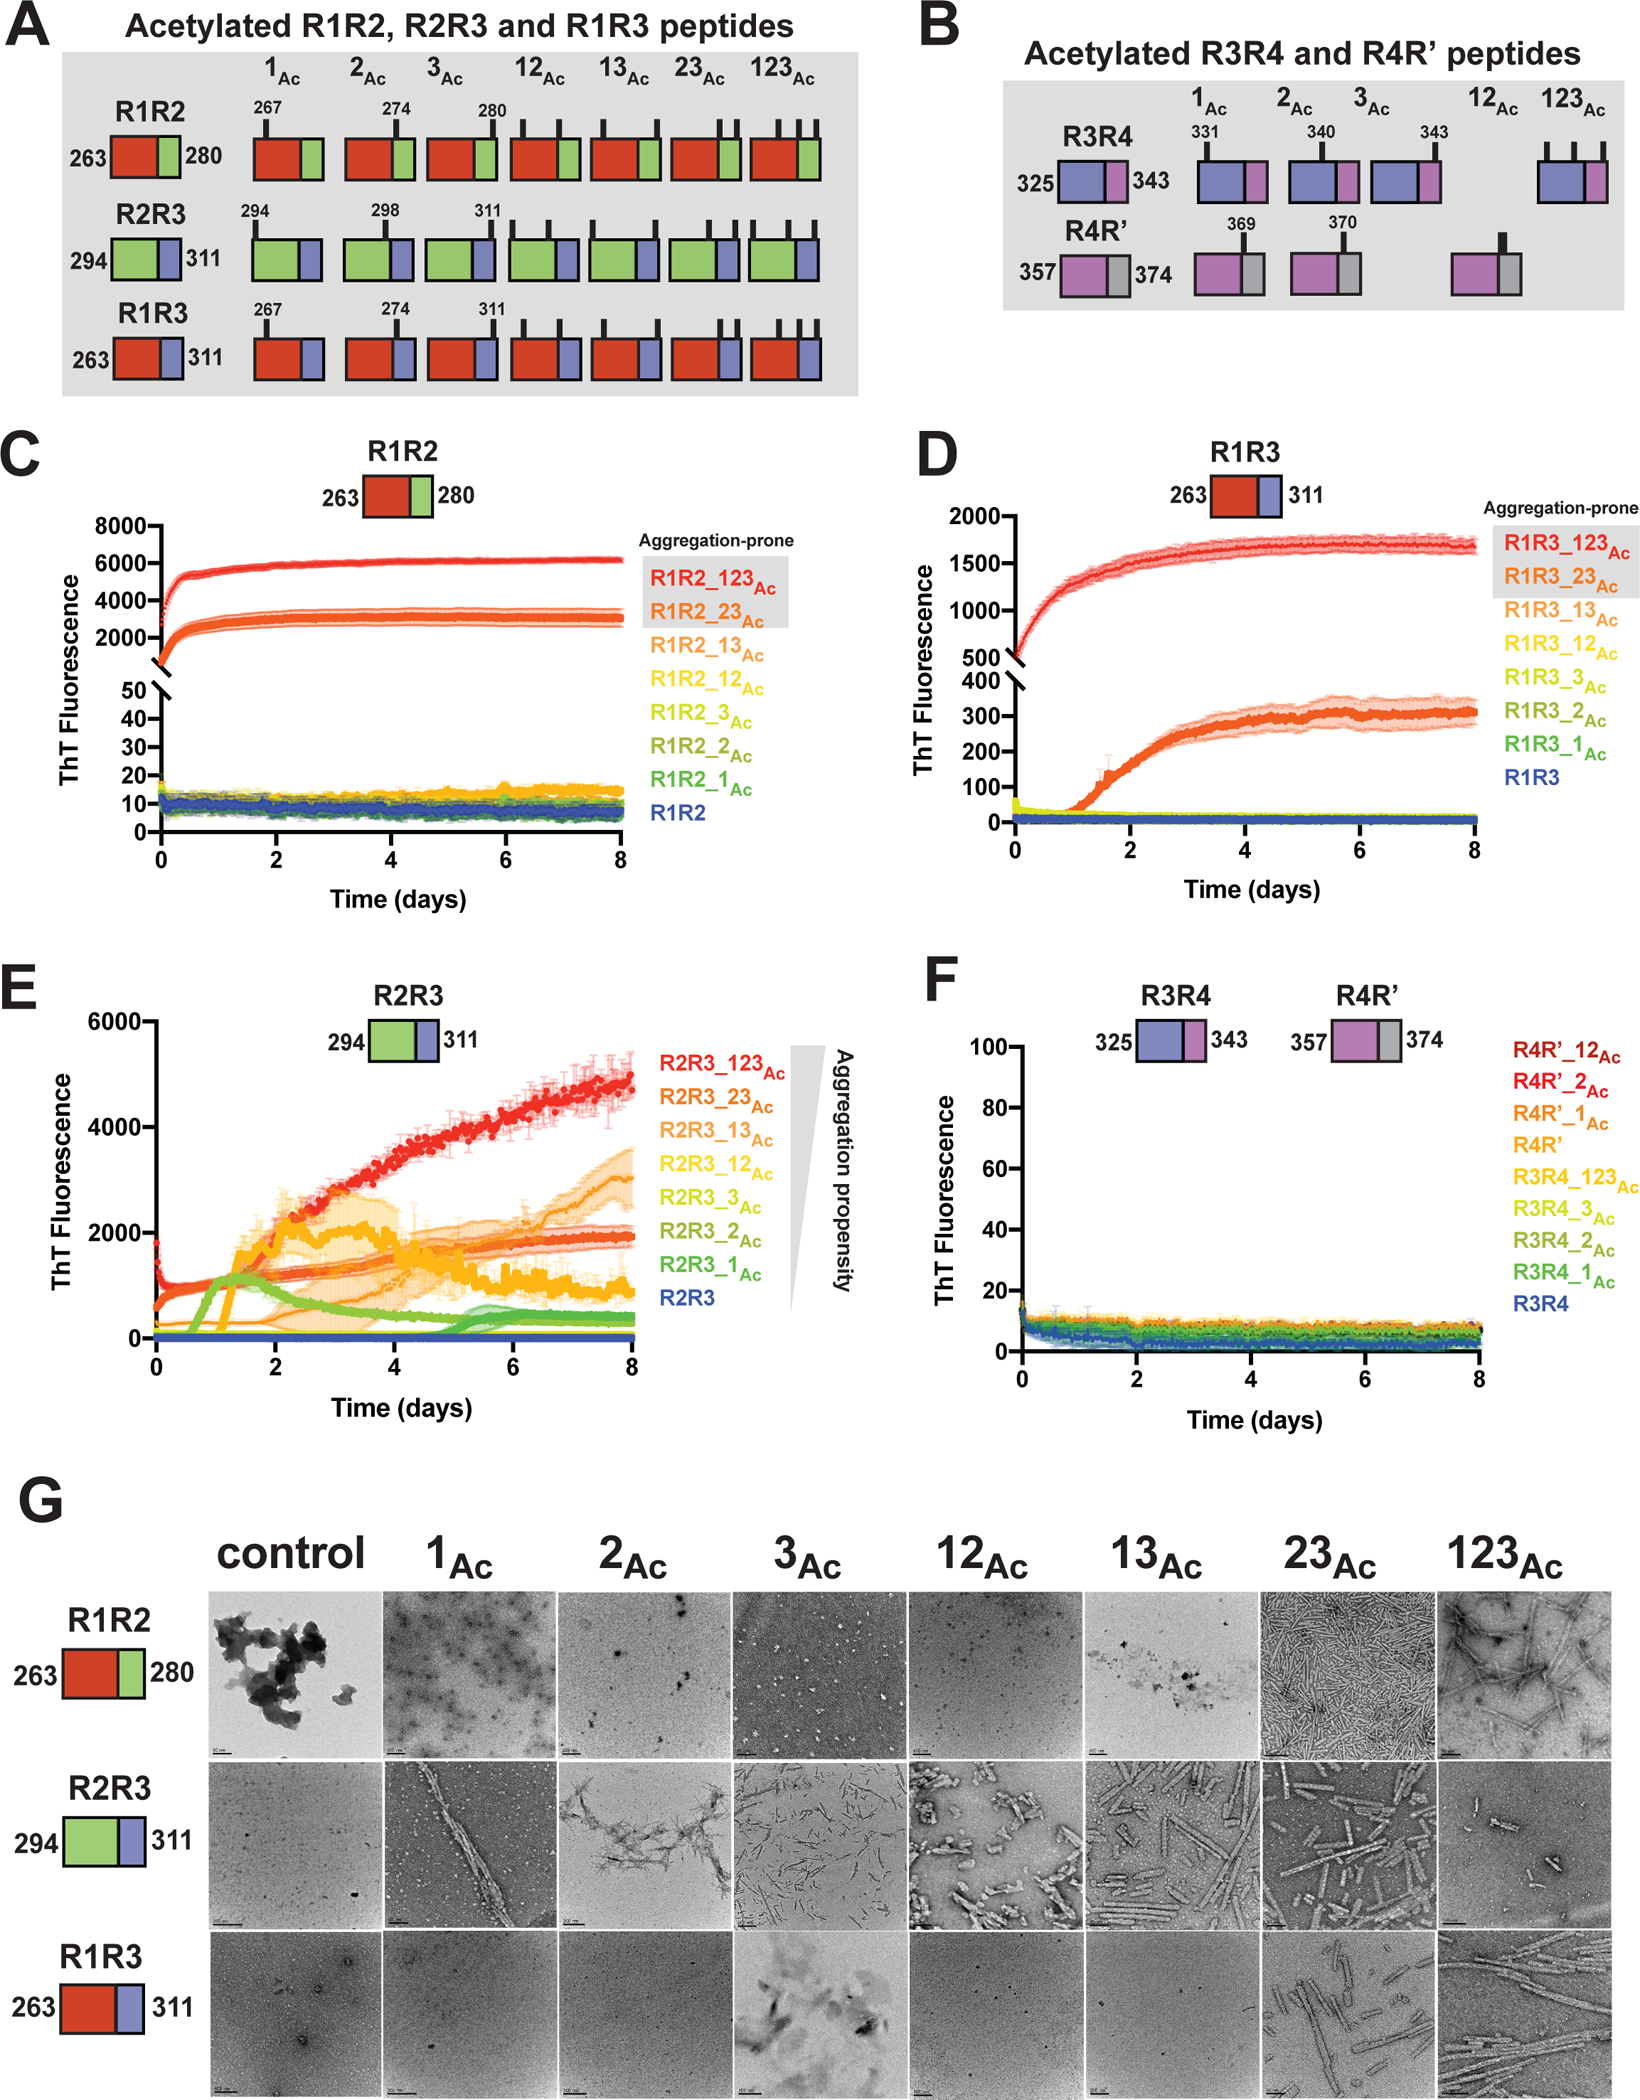
Figure 2. Site-specific acetylation on tau peptides reveals patterns of modification that regulate aggregation propensity.

Illustration of the tau peptide series with all combinatorial acetylation patterns for the R1R2, R2R3 and R1R3 (A) and the R3R4 and R4R’ (B) tau peptides. Sequences are colored by repeat domain as in Figure 1A. Acetylation sites are indicated by ticks above the cartoon for each peptide. ThT fluorescence aggregation experiments of the R1R2 (C), R2R3 (D), R1R3 (E) and R3R4/R4R’4 (F) unmodified and acetylation modified series. Curves are colored by the number of modifications from blue (control) to red (fully modified). Aggregation experiments were performed in triplicate and the averages are shown with standard deviation. The data were fit to a non-linear regression model fitting in GraphPad Prism to estimate an average t1/2max with a standard deviation. G. TEM images of ThT fluorescence aggregation assay end products from control (WT) and each acetylated peptide. Scale bars indicate 0.05–0.2 μm.
