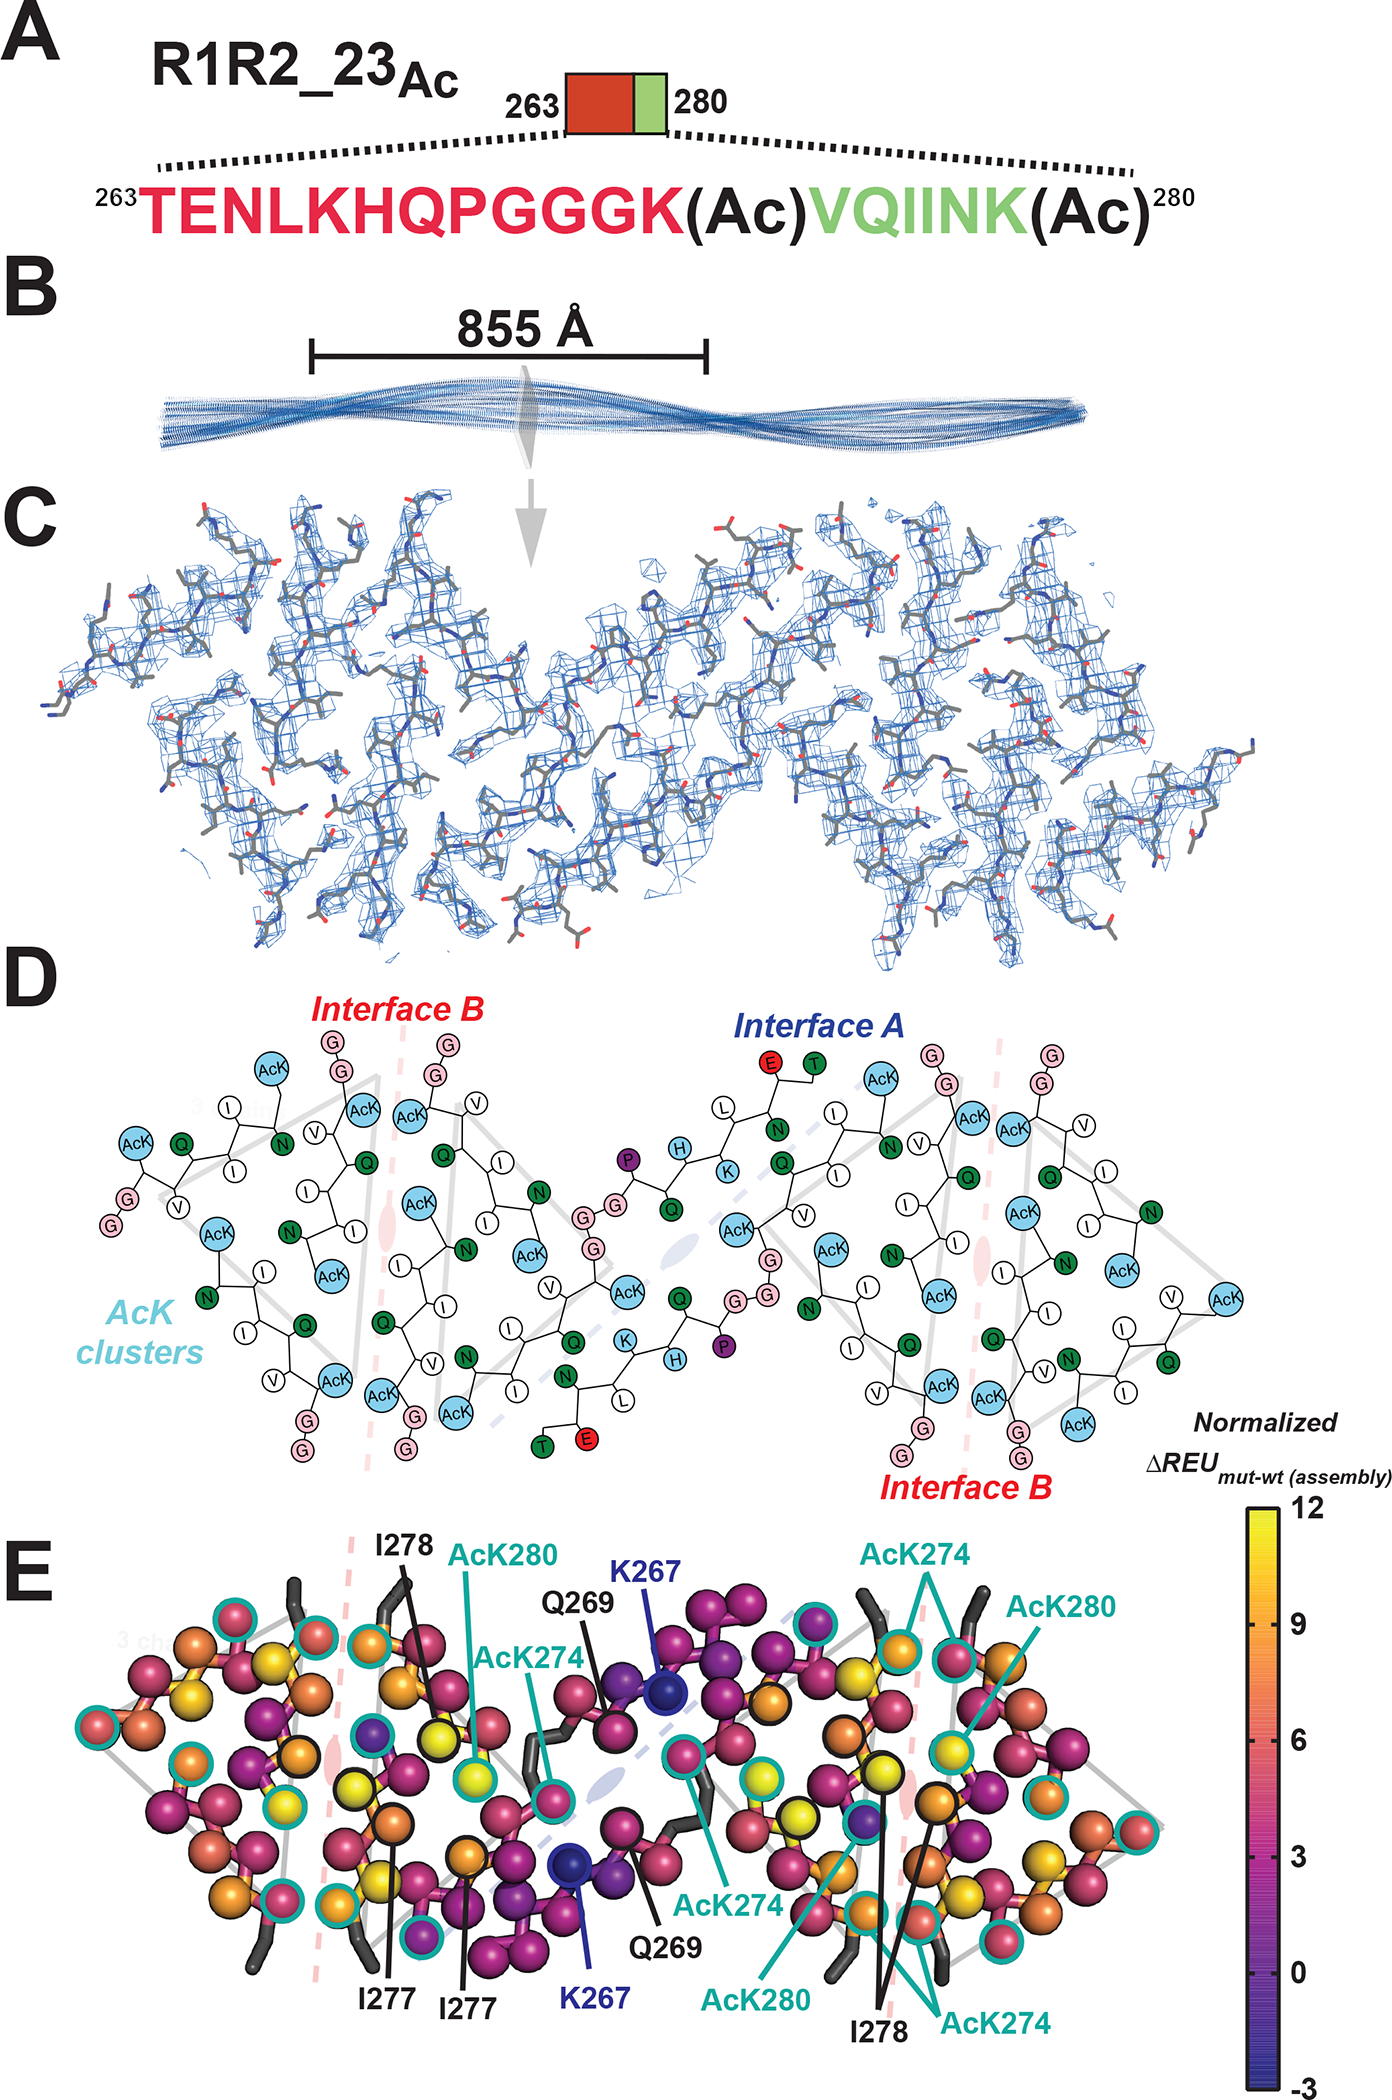
Figure 3. Cryo-EM structure of the R1R2_23Ac fibril.

A. Schematic of the R1R2_23Ac sequence and the acetylation sites. The sequence is colored as in Figure 1A. Lysine acetylation sites are indicated by “Ac” following the modified lysine residue. B. 3D reconstruction of the fibril illustrating the cross-over distance. The fibril is shown in cartoon and is colored in blue. A single layer of the fibril is illustrated as a slice. C. Fit between the model and map of a single layer is contoured at 7 σ. Structure is shown as sticks with backbone and side chains. D. 2D illustration of the amino acid composition of the 12 molecules in the layer. AcK and lysine residues are colored light blue, nonpolar residues are white, polar residues are green, acidic residues are red and glycines are colored in pink. The description of the symmetry of the different molecules described in Figure 3E are shown in the background. E. Mapping per residue profiles onto our cryo-EM structure uncovers residues that contribute more to stability of the monolayer assembly. Structures are shown as a single layer shown in ribbons with C-beta atoms shown in spheres for each amino acid. The C-beta is colored by changes in energy due to individual amino acid mutations to alanine using the plasma color scheme, yellow (12 ΔREUs, important) to blue (−3 ΔREUs, not important). Key residues in each interface are indicated by arrows. The description of the symmetry of the different molecules described in Figure 3E are shown in the background.
