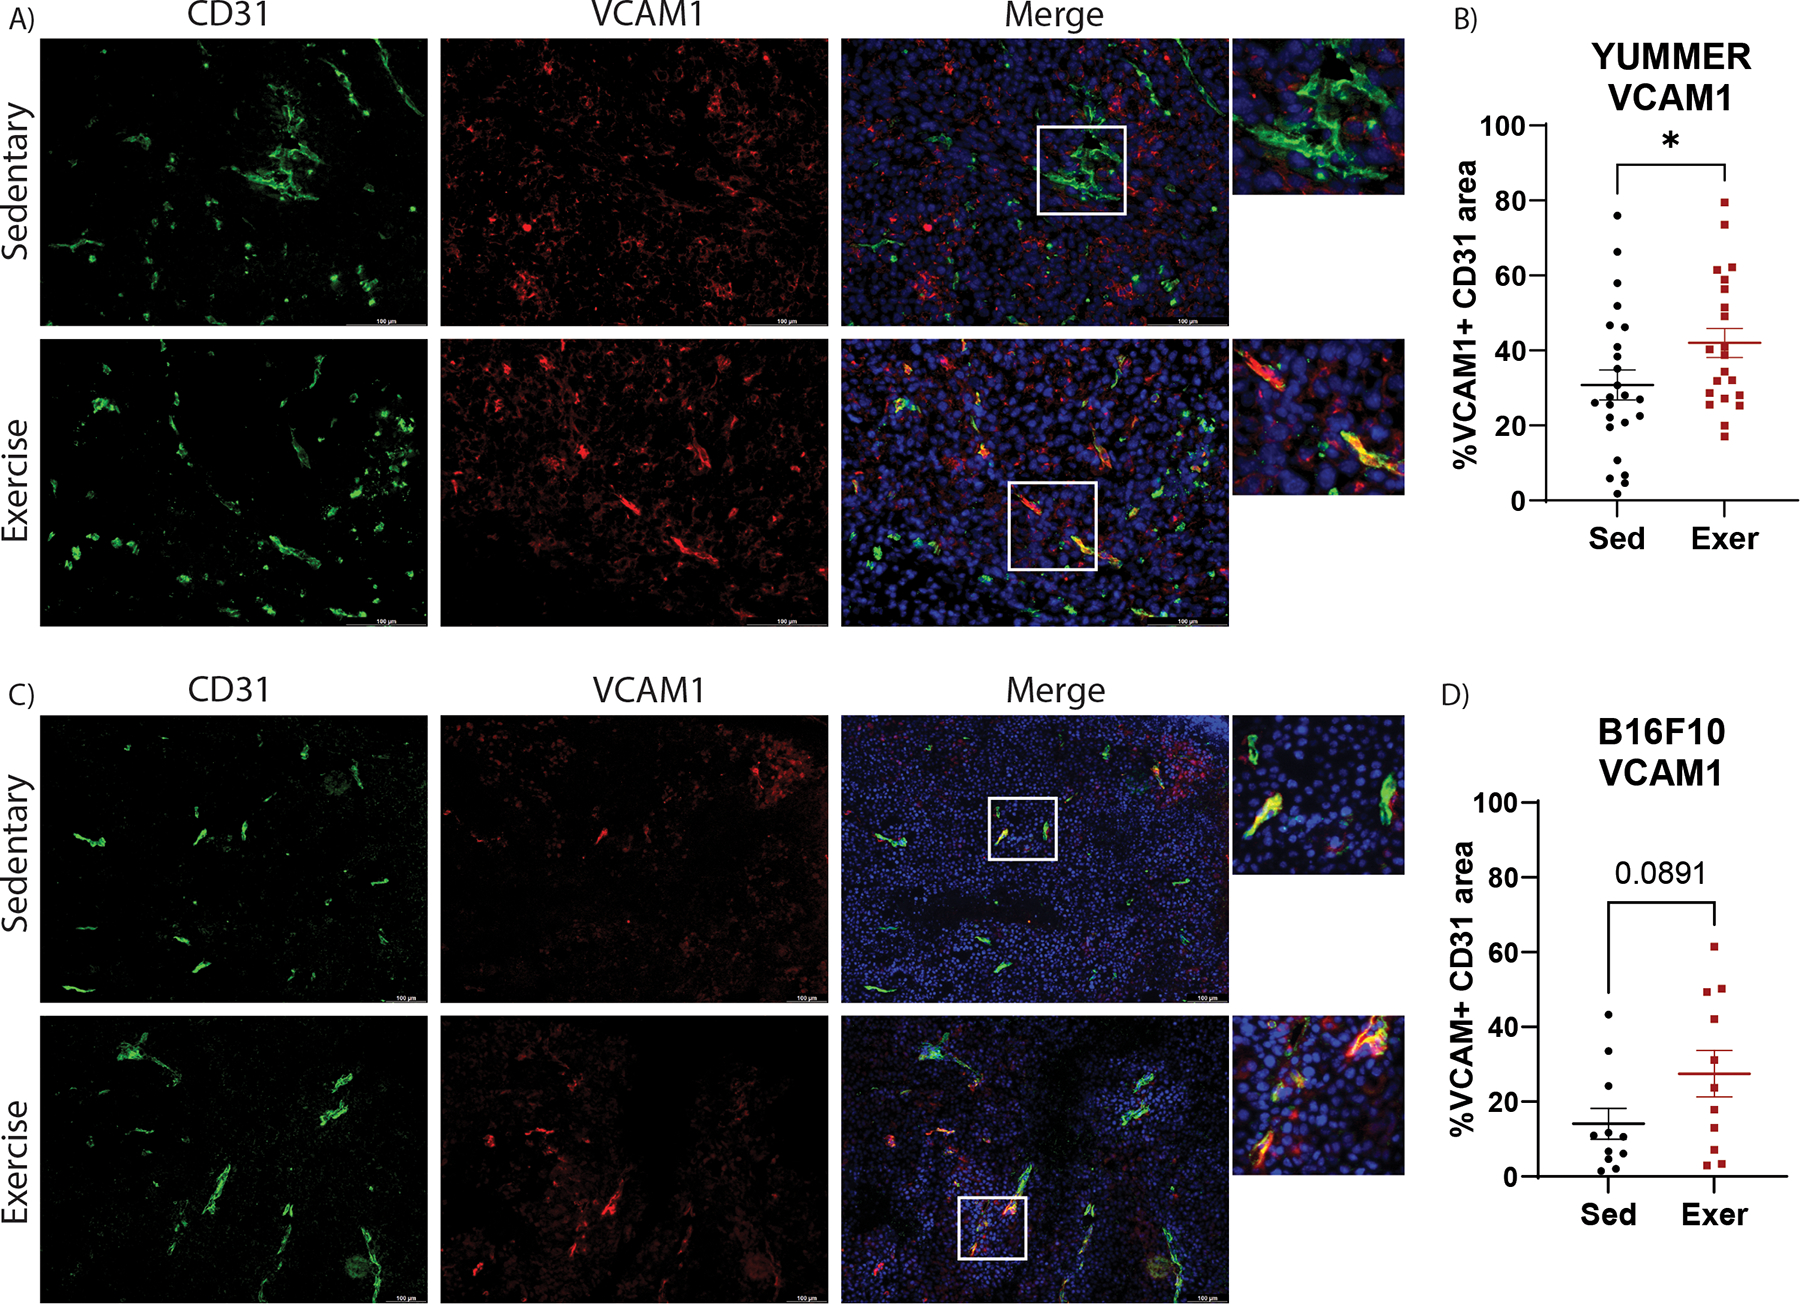
Figure 2. Exercise increases VCAM1 expression in melanoma tumor vasculature.

Immunofluorescent images of CD31 (green), VCAM1 (red) and DAPI (blue) in A) YUMMER and C) B16F10 tumors scale bar: 100μm. Images are representative of ≥ 5 images per tumor, ≥ 8 tumors per treatment group. Percent of VCAM1+ CD31+ vessel area was quantified in B) YUMMER and D) B16F10 images. Graphs are displayed with lines showing mean +/− standard error of the mean (SEM); each point represents one tumor value obtained by the average of ≥ 5 10x or 20x microscopic fields. T-test results are represented on graphs according to the following: ns= p > 0.05, *p ≤ 0.05, **p ≤ 0.01, ***p ≤ 0.001, ****p ≤ 0.0001)
