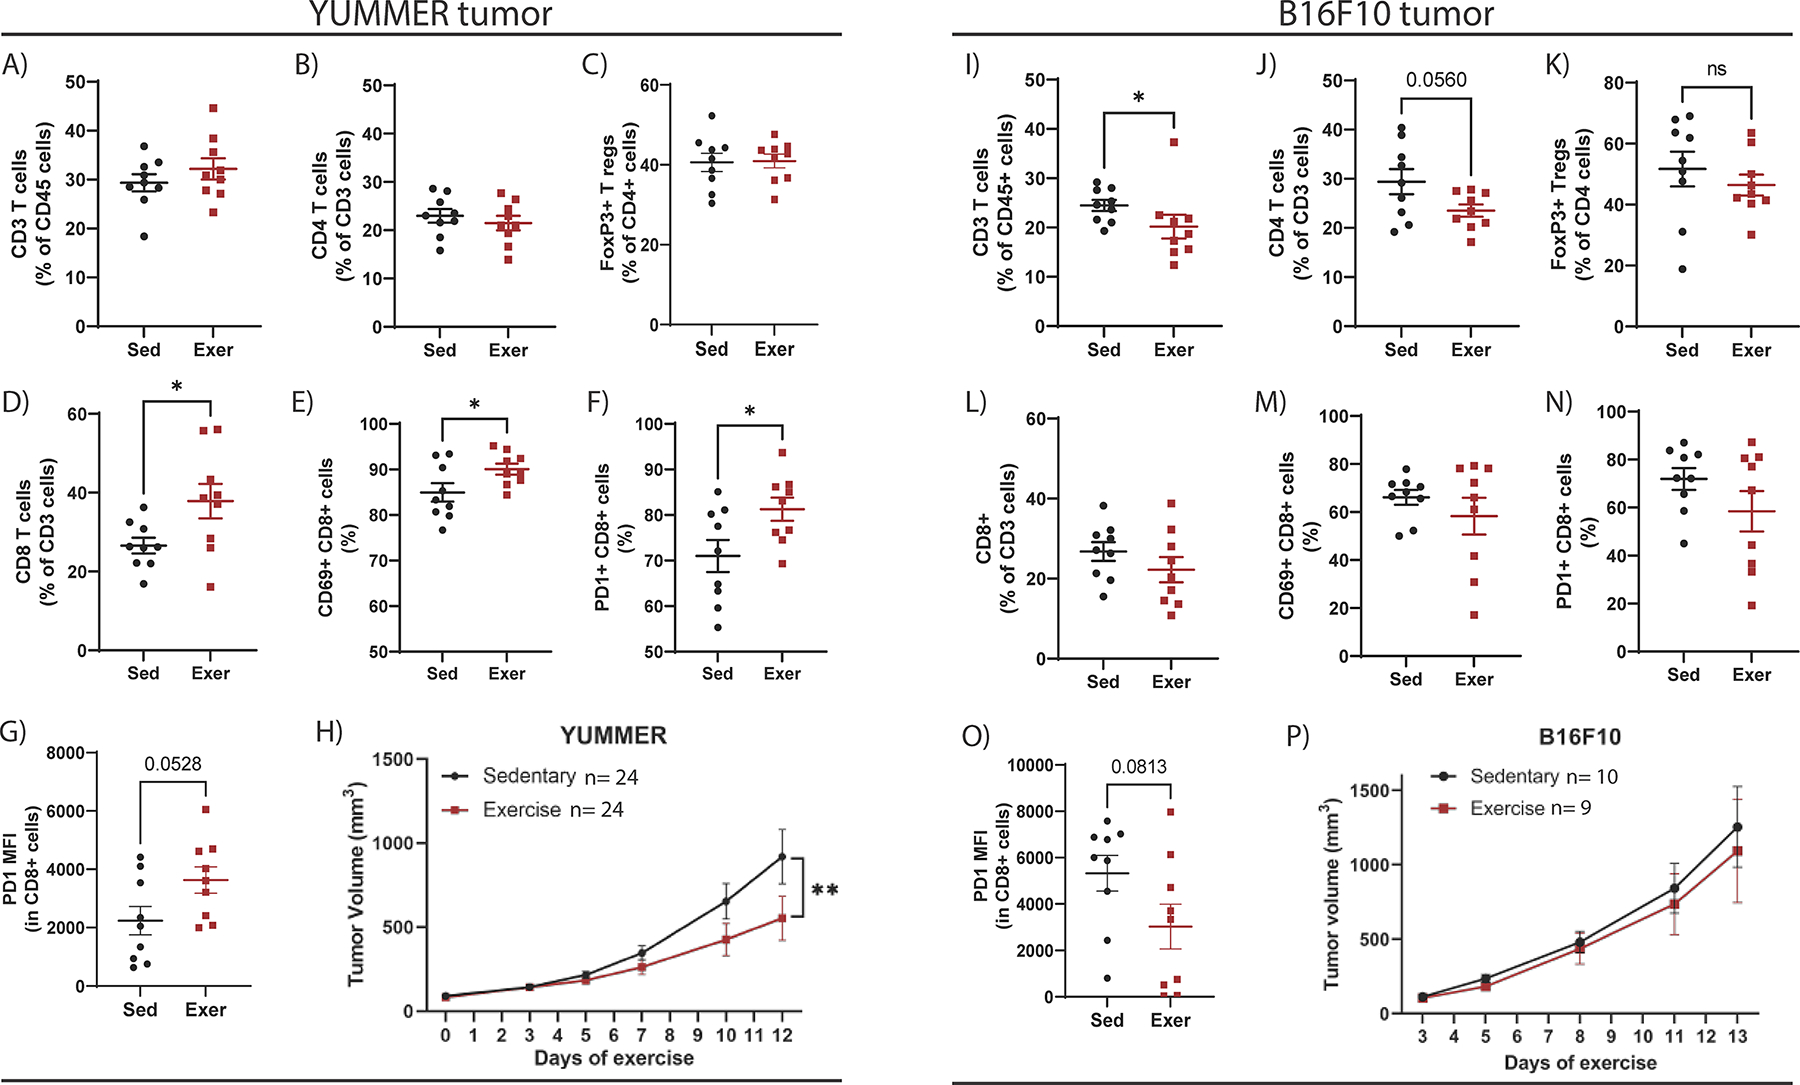
Figure 3. Aerobic exercise suppresses tumor growth and increases CD8+ T-cell infiltration in YUMMER but not B16F10 tumors.

Flow cytometry quantifications of YUMMER tumors to identify the percent of A) CD3+ T cells relative to CD45+ cells, B) CD4+ T cells relative to CD3+ cells, C) FoxP3+ Treg cells relative to CD4+ cells, D) CD8+ T cells relative to CD3+ cells, E) CD69+CD8+ T cells, and F) PD1+CD8+ cells. Flow cytometry quantification on G) YUMMER of PD1 median fluorescence intensity (MFI) in CD8+ T cells. H) YUMMER tumor volumes were monitored with calipers and graphed over time. Tumor growth curve was analyzed using two-way ANOVA (YUMMER two-way ANOVA; Time v Exercise: p=0.0107; Time: p<0.0001; Exercise: p=0.1068) with post-hoc multiple comparisons displayed on graph. Flow cytometry quantifications of B16F10 tumors to identify the percent of I) CD3+ T cells relative to CD45+ cells, J) CD4+ T cells relative to CD3+ cells, K) FoxP3+ Treg cells relative to CD4+ cells, L) CD8+ T cells relative to CD3+ cells, M) CD69+CD8+ T cells, and N) PD1+CD8+ cells. Flow cytometry quantification O) B16F10 tumors of PD1 median fluorescence intensity (MFI) in CD8+ T cells. P) B16F10 tumor volumes were monitored with calipers and graphed over time. Tumor growth curve was analyzed using two-way ANOVA (B16F10 two-way ANOVA; Time v Exercise: p=0.9795; Time: p=0.0002; Exercise: p=0.6706) with post-hoc multiple comparisons displayed on graph. Graphs are displayed with lines showing mean +/− SEM. Each point on a graph represents one tumor analyzed. ns= p > 0.05, *p ≤ 0.05, **p ≤ 0.01, ***p ≤ 0.001, ****p ≤ 0.0001. Mouse experiment comparing sedentary and exercise treatment was repeated four times in the YUMMER model and three times in B16F10 model.
