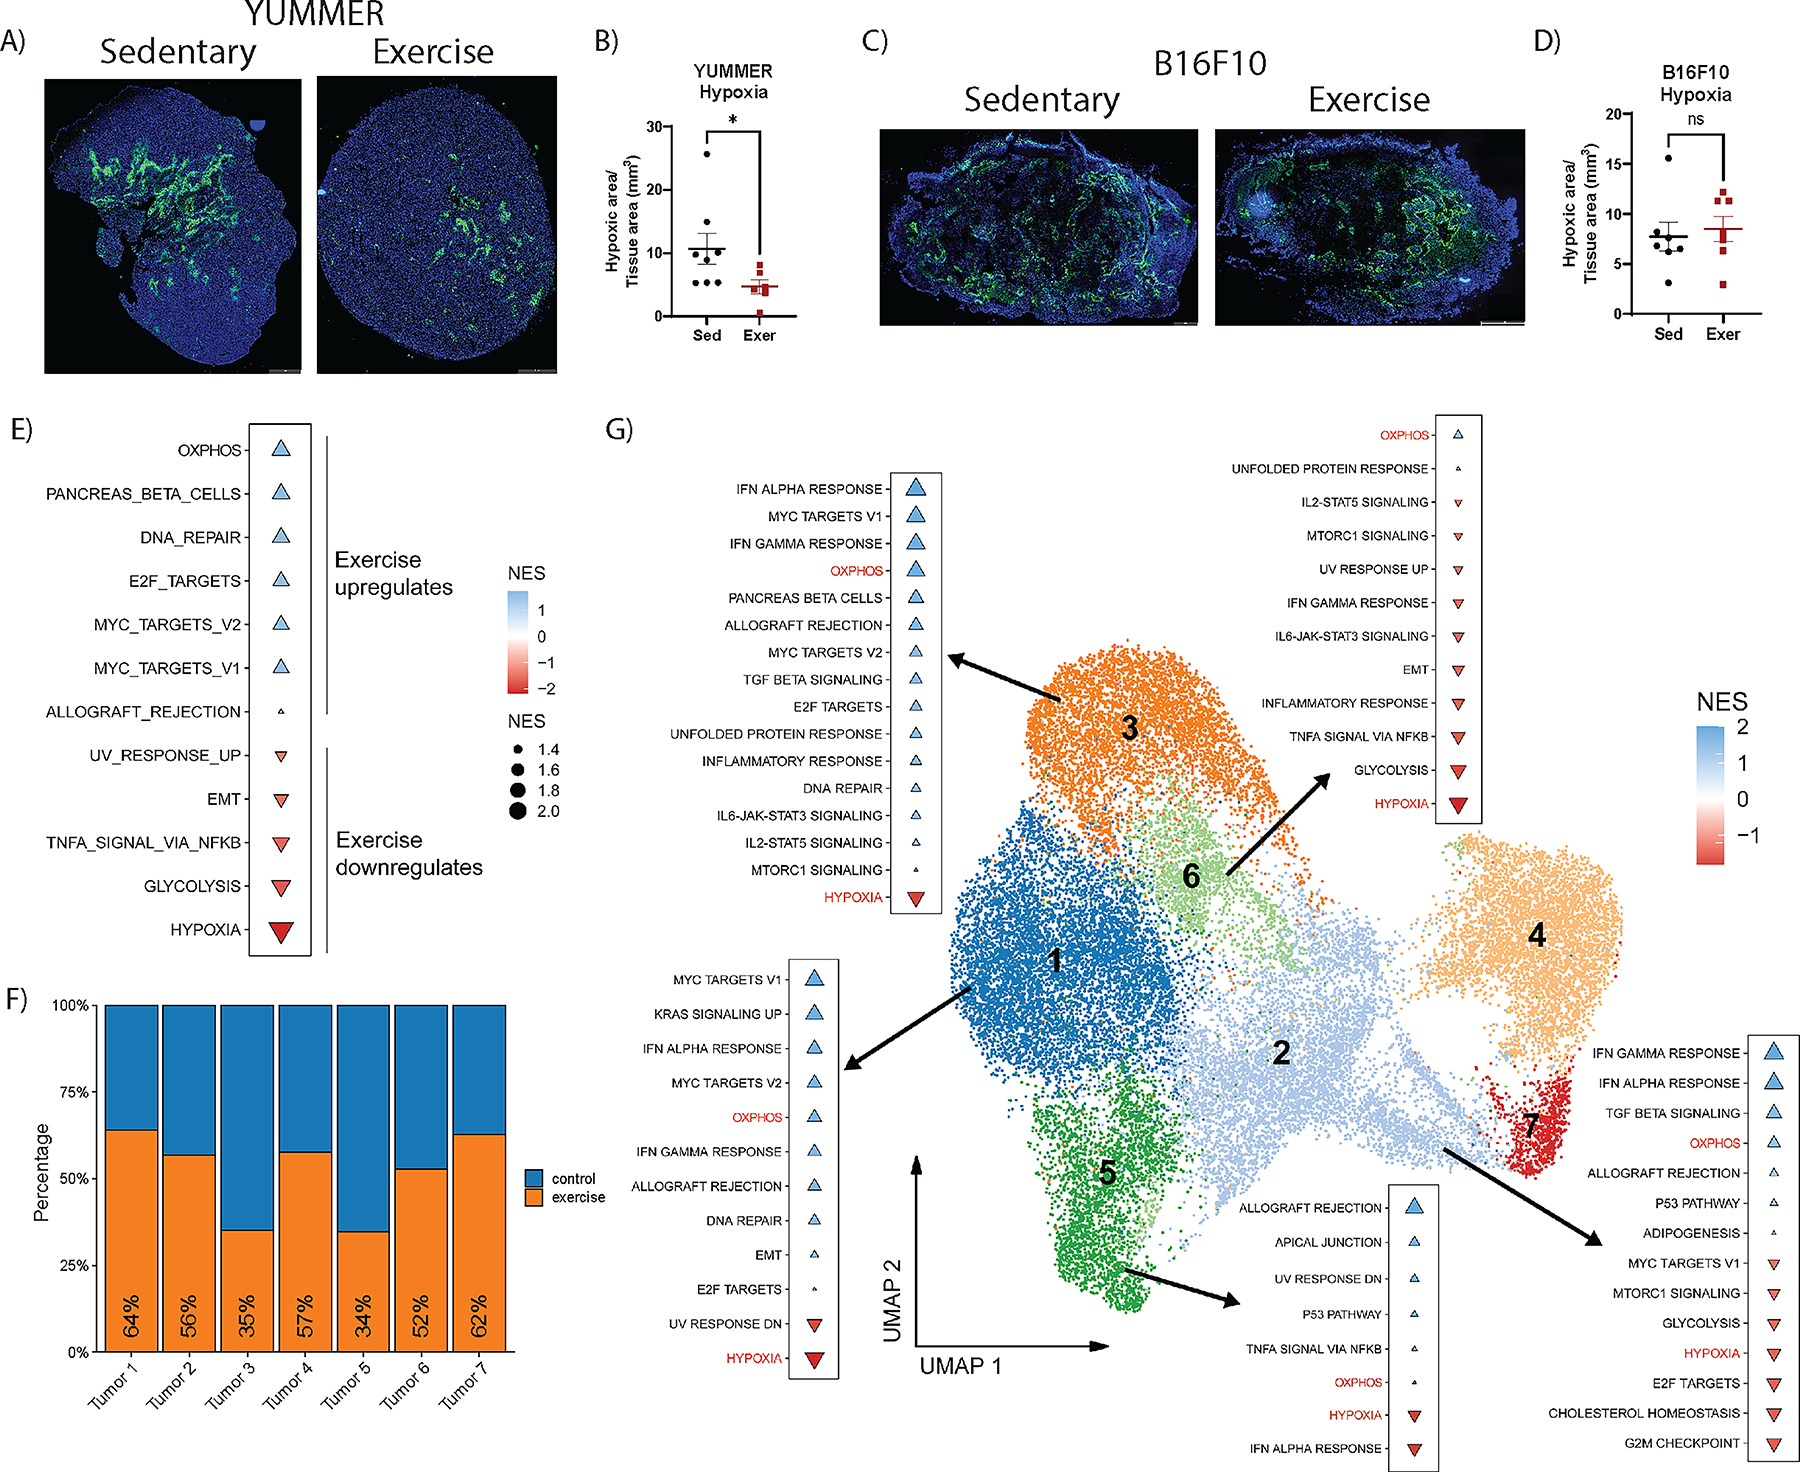
Figure 4. Exercise reduces hypoxia in YUMMER tumors.

Quantification of hypoxic regions measured by percent of hypoxyprobe-1+ area: total tumor tissue area in tile scan images of A, B) YUMMER and C, D) B16F10 tumors; scale bar: 1mm. Each point on the graphs represents one tumor. Lines on the graph indicate the mean +/− standard error of the mean (SEM). T-test results are indicated by * p<0.05, or ns = non-significant. E) GSEA analysis with significant altered pathways using the hallmarks of cancer gene sets comparing non-cycling tumor cell clusters from scRNA-seq dataset of YUMMER tumors from exercise and sedentary mice (n=3 per group), in which blue triangles represent exercise upregulated pathways and red triangles represent exercise downregulated pathways. Triangle size is proportional to normalized enrichment score (NES). F) Proportion of tumor cells from each cluster from control (blue) samples and exercised (orange) samples. G) UMAP plot of all tumor cells labeled with cluster number. GSEA using the hallmarks of cancer of exercise compared to sedentary samples for clusters Tumor 1, 2, 3, 5, and 6.
