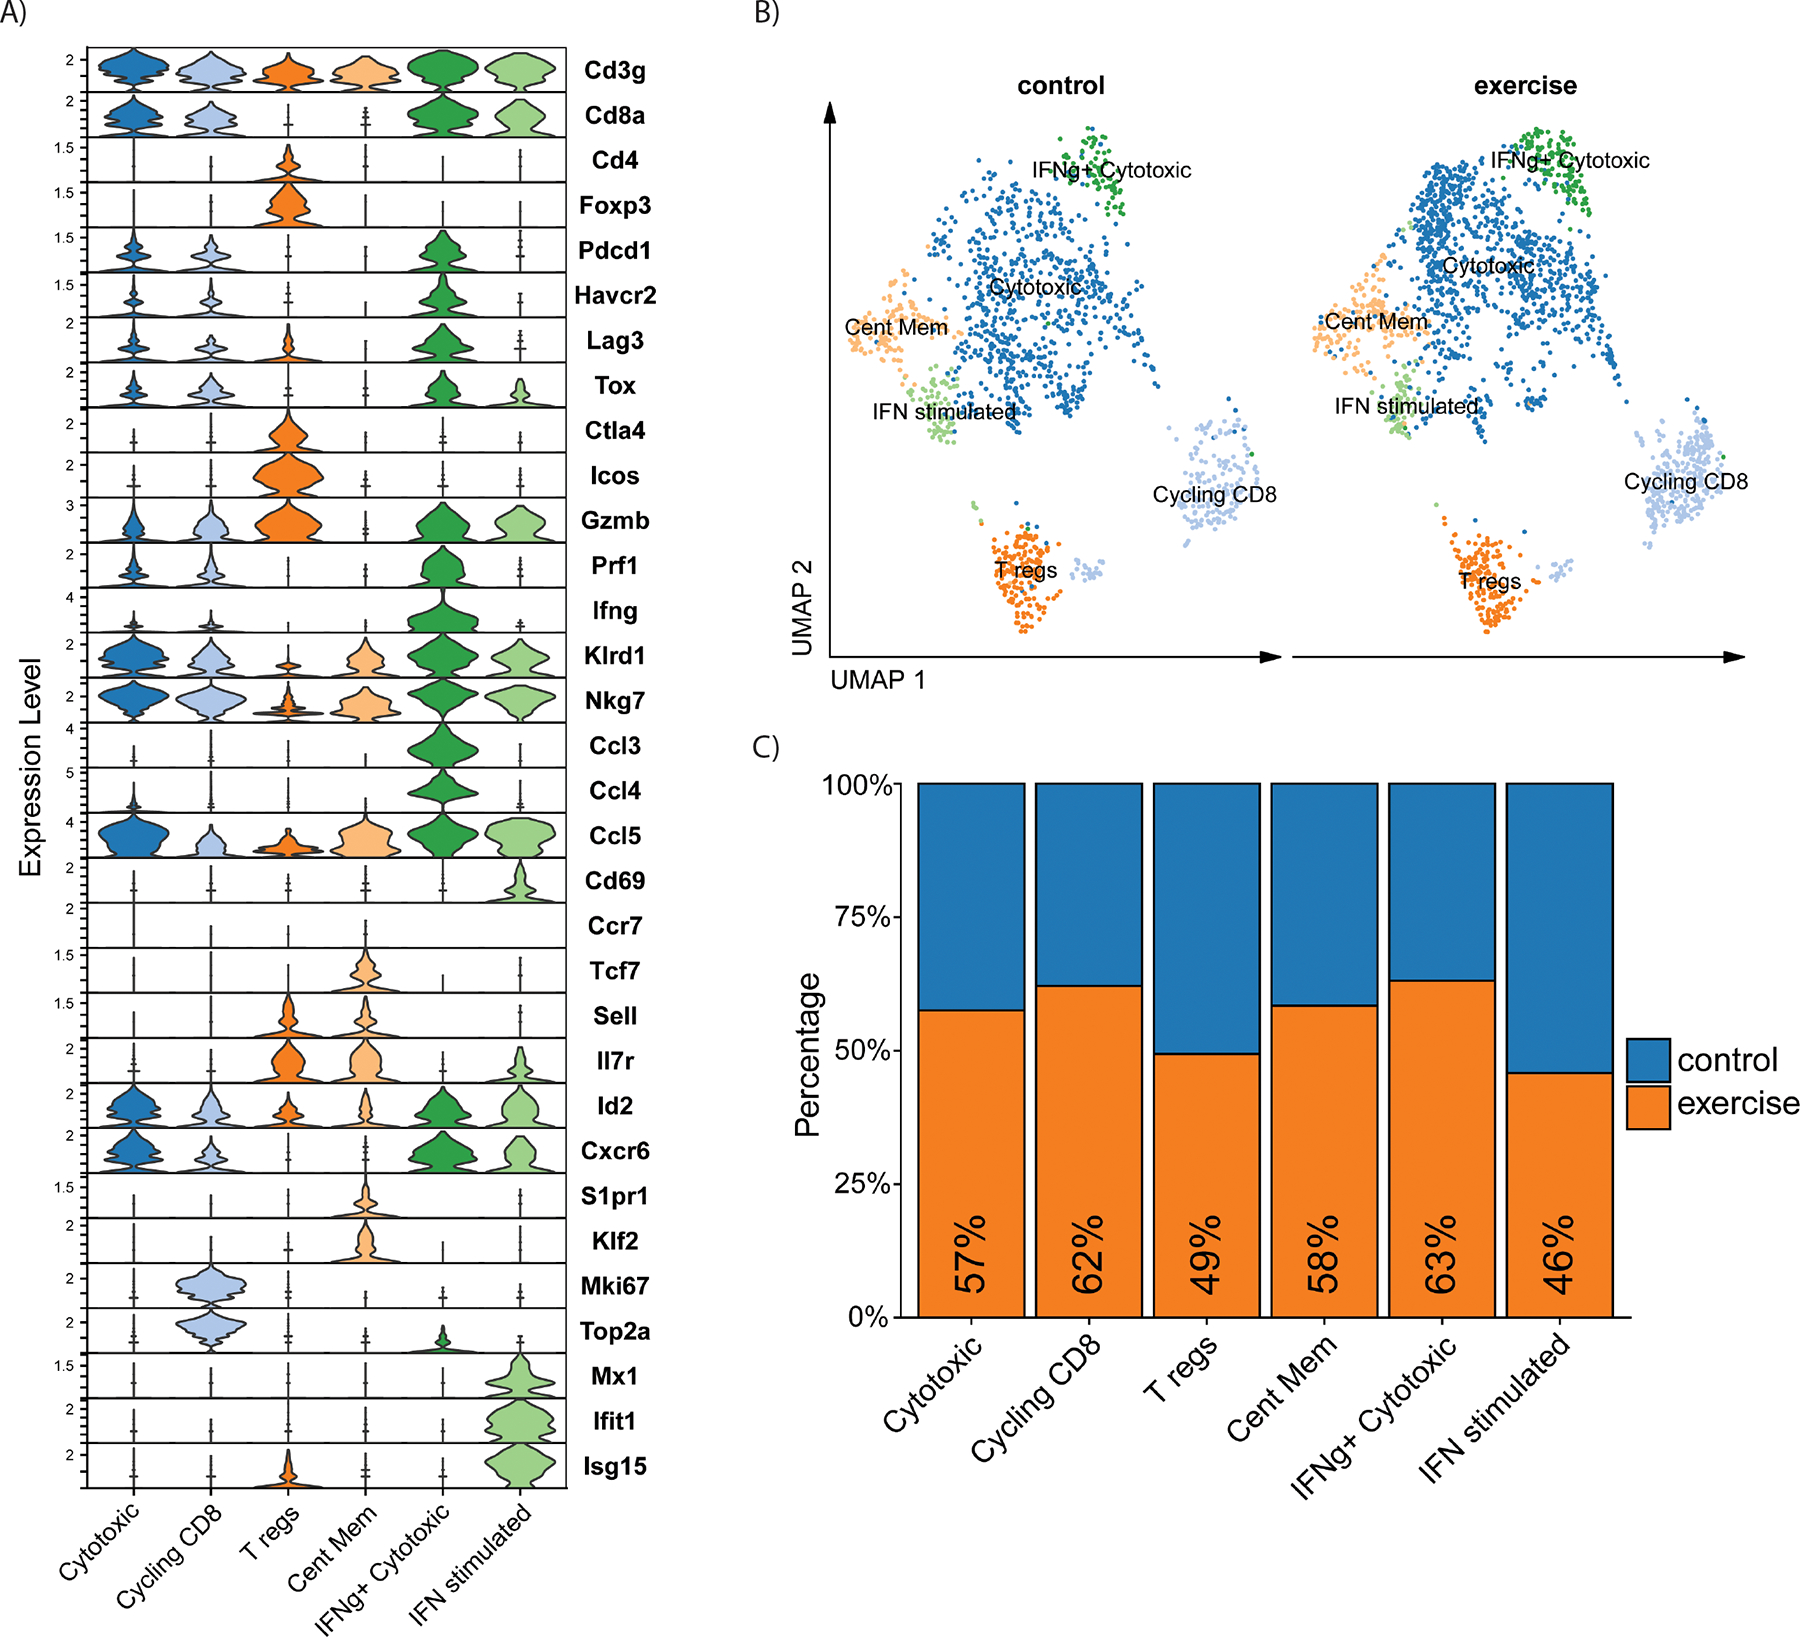
Figure 5. scRNAseq characterization of T-cell populations in YUMMER tumors after sedentary or exercise treatment.

Analysis of the scRNA-seq dataset of YUMMER tumors from exercise and sedentary mice (n=3 per group) from figure 4. A) Stacked violin plot of T-cell gene expression across scRNA-seq T-cell clusters. B) UMAP plot of T cells in YUMMER tumors from control (left) and exercise (right) samples. C) Proportions of the T-cell clusters from control (blue) samples versus exercised (orange) samples
