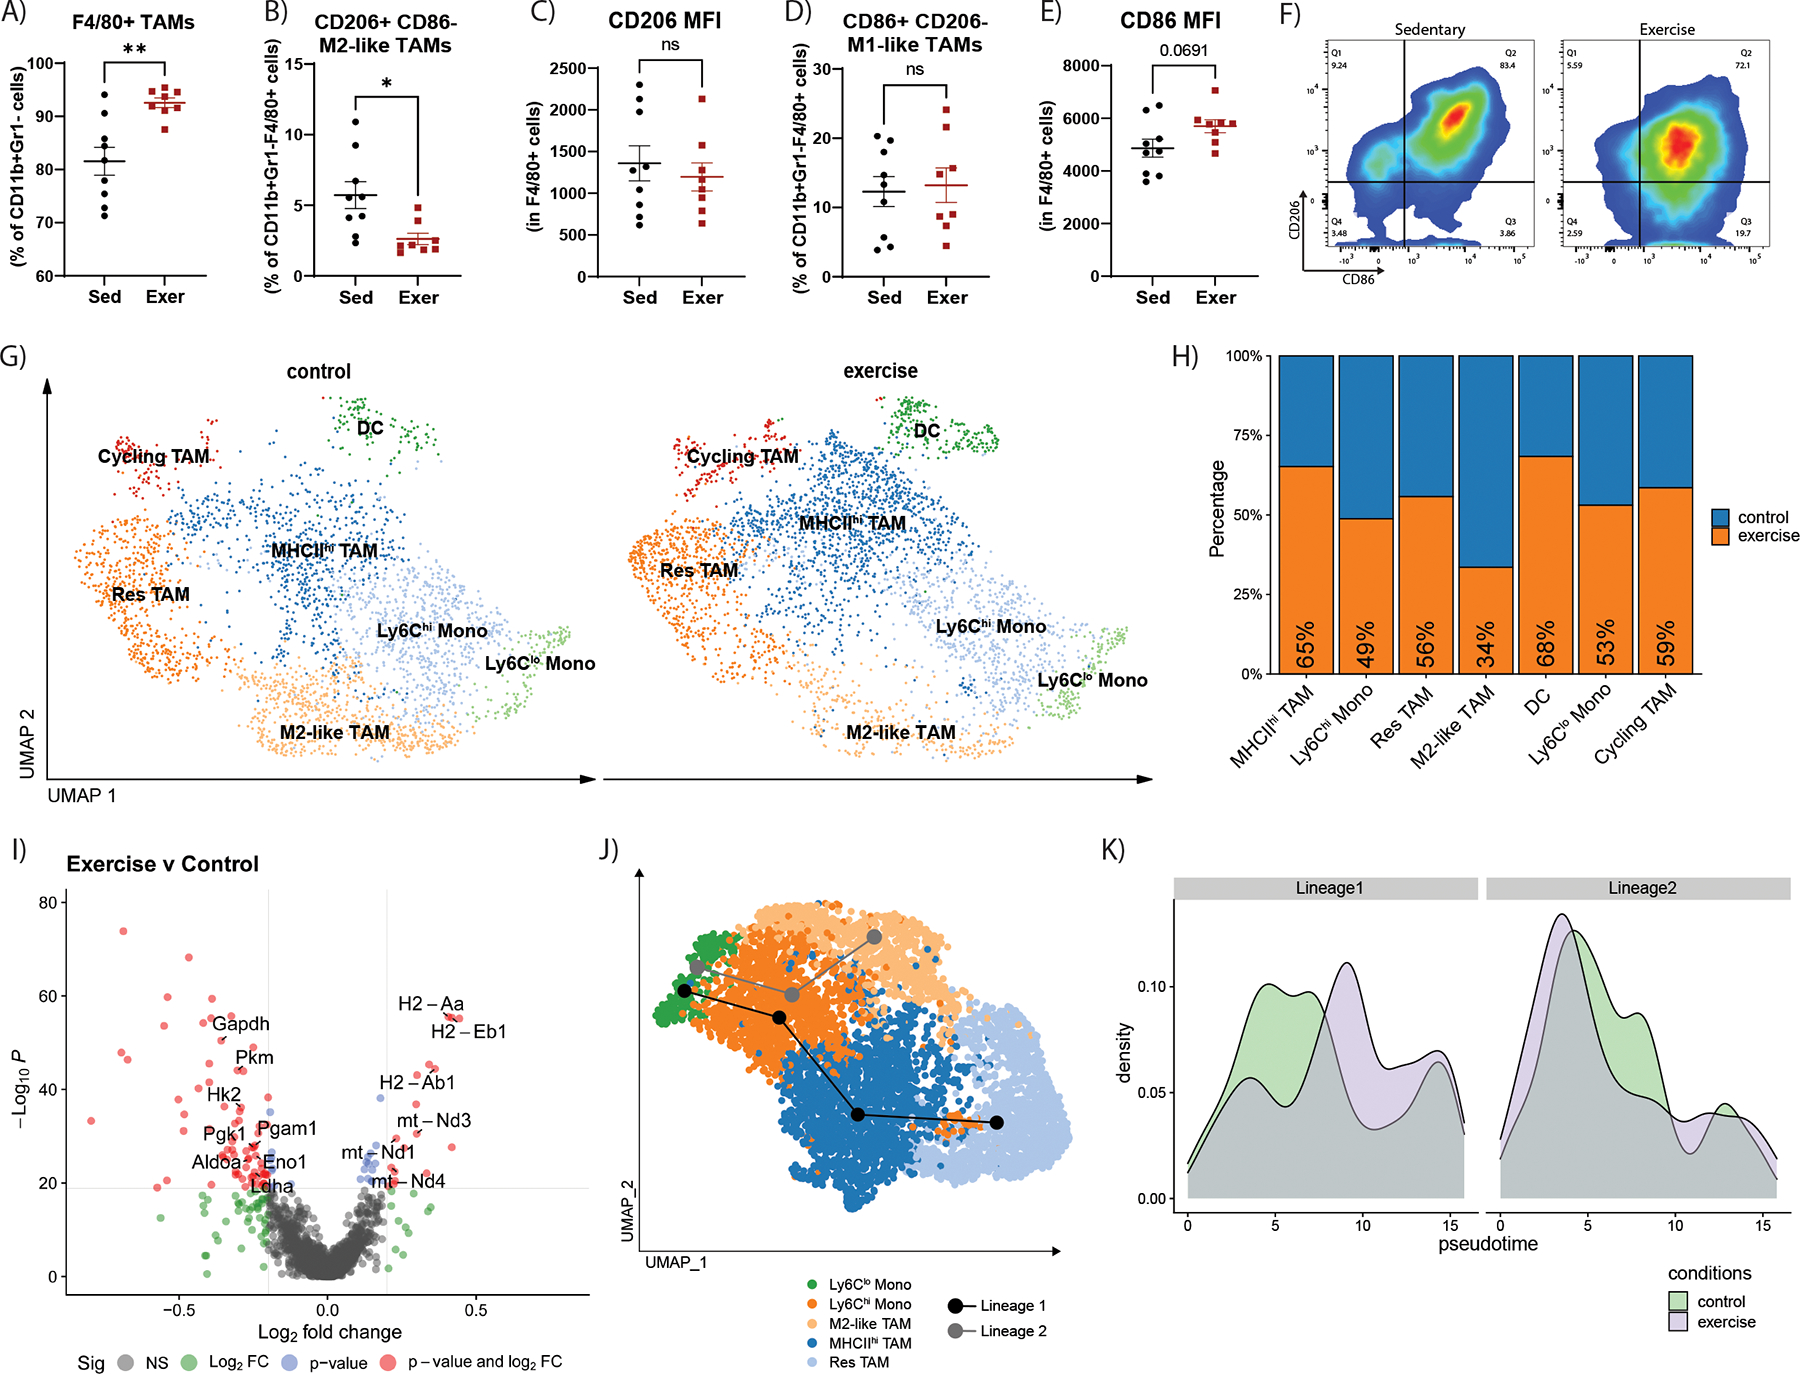
Figure 6. Exercise reduces M2-like TAMs and alters the transcriptome of myeloid cells.

Flow cytometry quantifications of YUMMER tumors of the percent of A) F4/80+ TAMs relative to CD11b+Gr1− cells, B) CD206+CD86− TAMs relative to CD11b+Gr1−F4/80+ cells, C) CD206 MFI in CD11b+Gr1−F4/80+ cells, D) CD86+CD206− TAMs relative to CD11b+Gr1−F4/80+ cells, and E) CD86 MFI in CD11b+Gr1−F4/80+ cells. F) Representative flow cytometry plots of CD206 marker versus CD86 marker in CD11b+Gr1−F4/80+ cells. Graphs are displayed with lines showing mean +/− SEM. Each point on the graphs represents one tumor analyzed. T-test results are represented on graphs according to the following: ns= p > 0.05, *p ≤ 0.05, **p ≤ 0.01, ***p ≤ 0.001, ****p ≤ 0.0001. G-J) Analysis of the scRNA-seq dataset of YUMMER tumors from exercise and sedentary mice (n=3 per group) from figure 4 G) UMAP plot of myeloid cell populations in YUMMER tumors from control (left) and exercise (right) samples. H) Proportions of each cluster from control (blue) samples versus exercised (orange) samples. I) Volcano plot showing differentially expressed genes in myeloid cells. Comparison: exercise versus control. J) Results of pseudotime trajectory analysis performed on non-cycling monocyte and TAM clusters revealed two predicted lineages which are represented with lines on the UMAP plot. Lineage 1: Ly6Clo Monos -> Ly6Chi Monos -> MHCIIhi TAM -> Res TAM (black line) and Lineage 2: Ly6Clo Monos -> Ly6Chi Monos -> M2-like TAM (gray line). K) Control (green) and exercise (purple) sample population density across Lineage 1 or Lineage 2 pseudotime.
