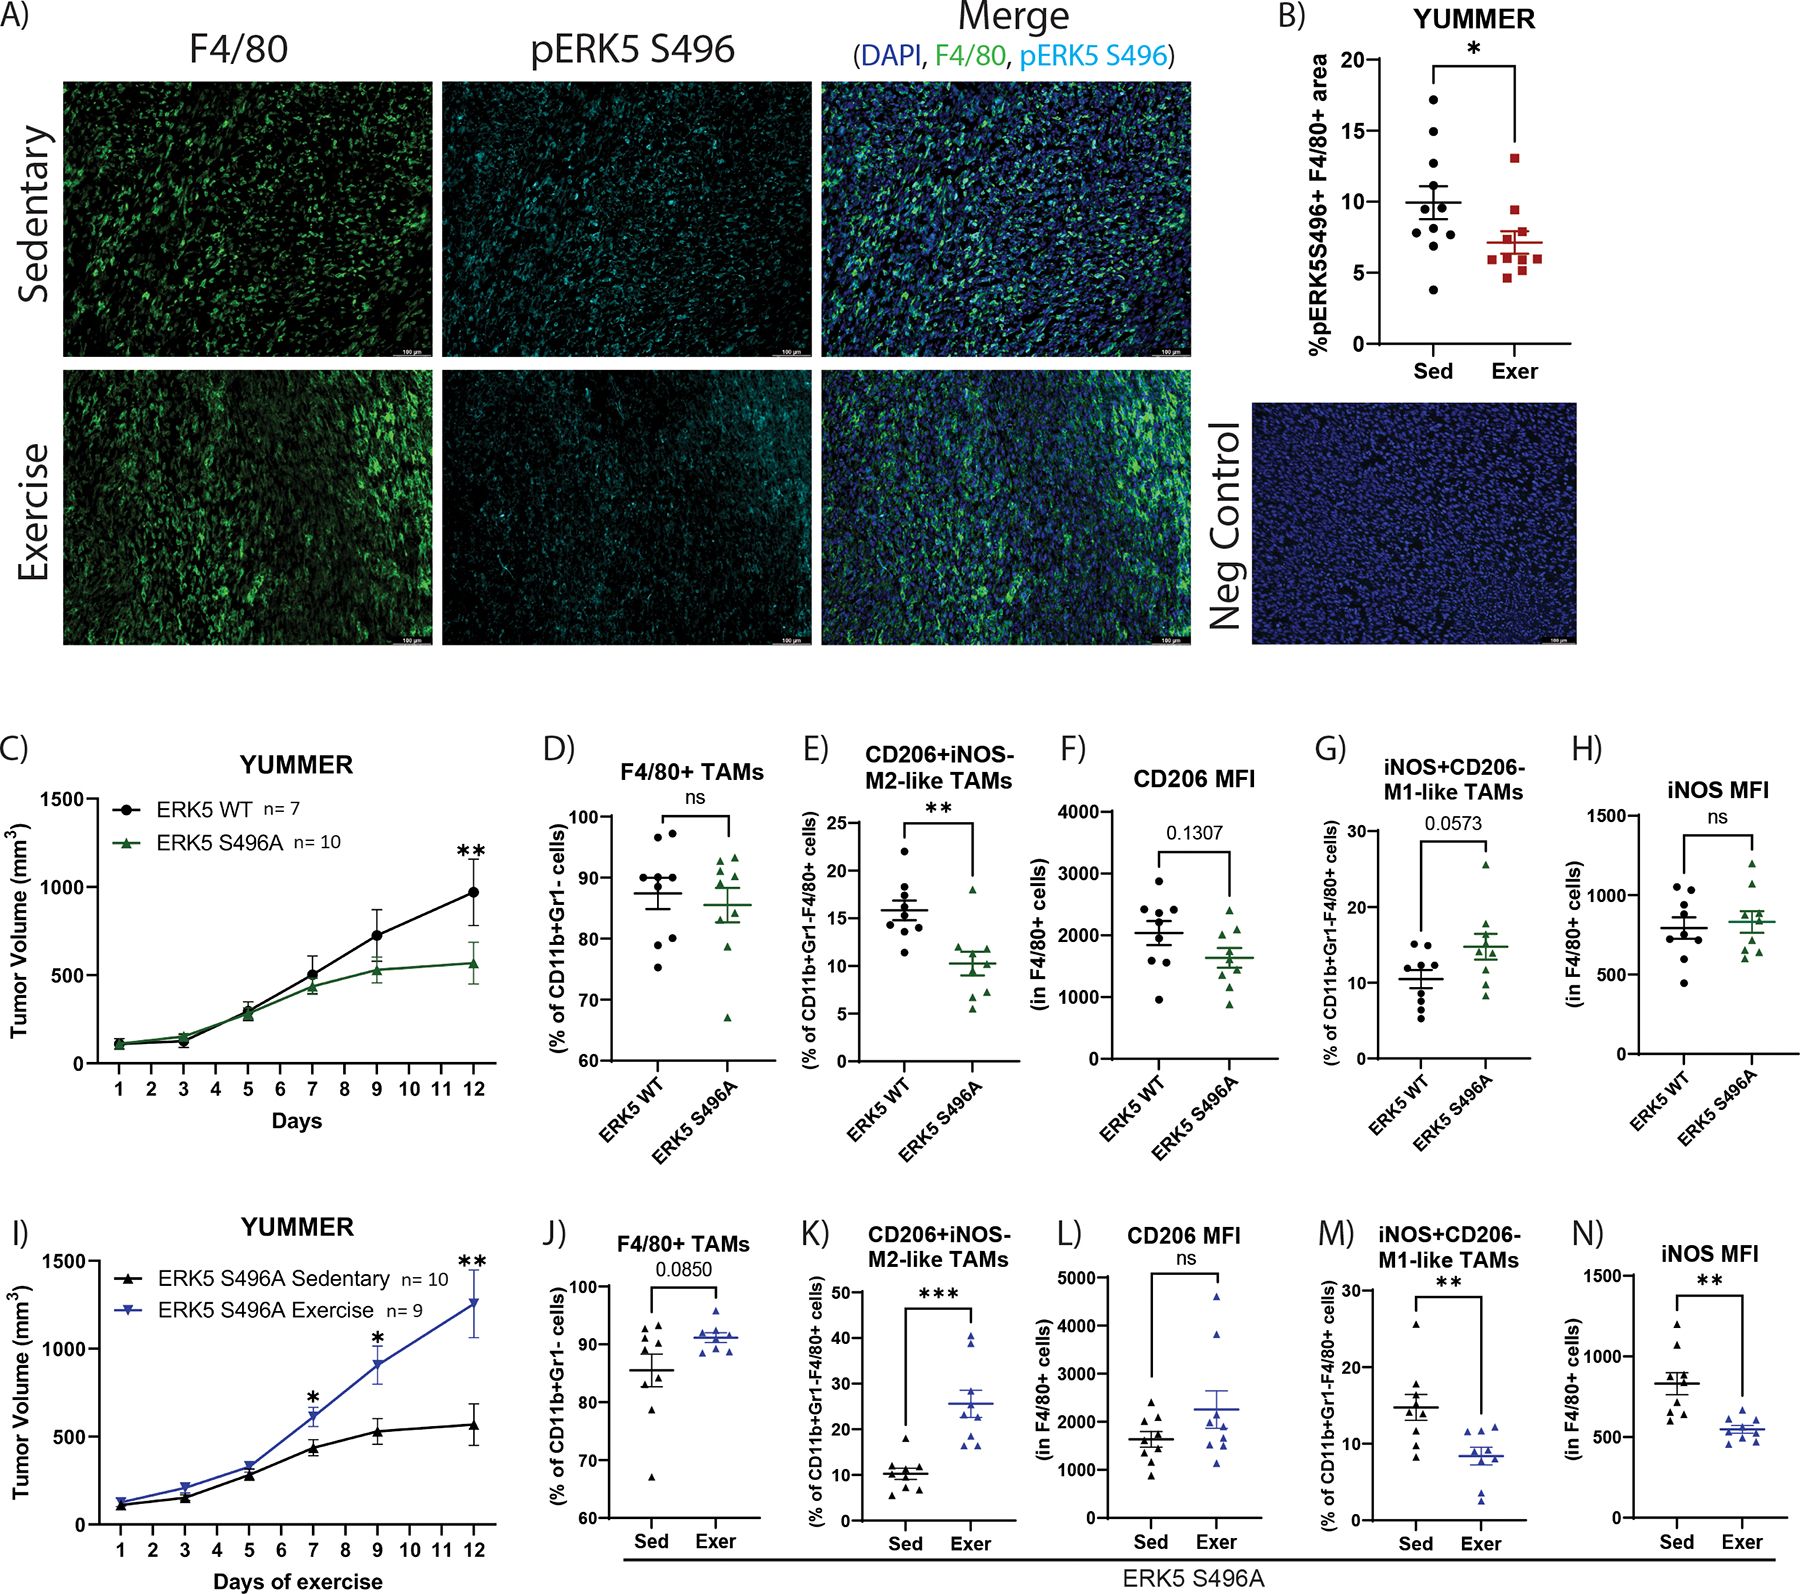
Figure 7. ERK5 S496A KI alters tumor growth and shifts TAM phenotype differently than with exercise.

YUMMER tumor–bearing mice performed approximately two weeks of treadmill exercise (Exer) or were non-exercised sedentary controls (Sed). A) Immunofluorescent images of F4/80 (marker for TAMs; green), phospho-ERK5 S496 (cyan), and DAPI (blue) on YUMMER tumors, representative of >5 microscopic fields per tumor and 7 –10 tumors per group; scale bar: 100μm. B) Quantification of percent of phospho-ERK5 S496+F4/80+ area in YUMMER tumors from sedentary or exercised mice. Graphs are displayed with mean +/− standard error of the mean (SEM); each point represents one tumor value obtained by the average of ≥ 5 10x microscopic fields. C) YUMMER tumor volume in ERK5 WT (C57Bl/6) mice and ERK5 S496A KI mice was monitored with calipers. Tumor growth curves were analyzed using two-way ANOVA (Time v ERK5S496A: p=0.0122; Time: p<0.0001; Exercise: p=0.0.2119) with post-hoc multiple comparisons displayed on graphs. ns= p > 0.05, *p ≤ 0.05, **p ≤ 0.01, ***p ≤ 0.001, ****p ≤ 0.0001. Flow cytometry quantification of the percent of D) F4/80+ TAMs relative to CD11b+Gr1− cells, E) CD206+iNOS− TAMs relative to CD11b+Gr1−F4/80+ cells, F) CD206 MFI in CD11b+Gr1−F4/80+ cells, G) iNOS+CD206− TAMs relative to CD11b+Gr1−F4/80+ cells, H) iNOS MFI in CD11b+Gr1−F4/80+ cells. I) YUMMER tumor volume in sedentary or exercised ERK5 S496A KI mice was monitored with calipers. Tumor growth curves were analyzed using two-way ANOVA (Time v Exercise: p<0.0001; Time: p<0.0001; Exercise: p=0.0061) with post-hoc multiple comparisons displayed on graphs. ns= p > 0.05, *p ≤ 0.05, **p ≤ 0.01, ***p ≤ 0.001, ****p ≤ 0.0001. Flow cytometry quantification of the percent of J) F4/80+ TAMs relative to CD11b+Gr1− cells, K) CD206+iNOS− TAMs relative to CD11b+Gr1−F4/80+ cells, L) CD206 MFI in CD11b+Gr1−F4/80+ cells, M) iNOS+CD206− TAMs relative to CD11b+Gr1−F4/80+ cells, N) iNOS MFI in CD11b+Gr1−F4/80+ cells. Mouse experiments utilizing ERK5 S496A KI mice were independently repeated two times. Each point on a graph represents one tumor analyzed.
