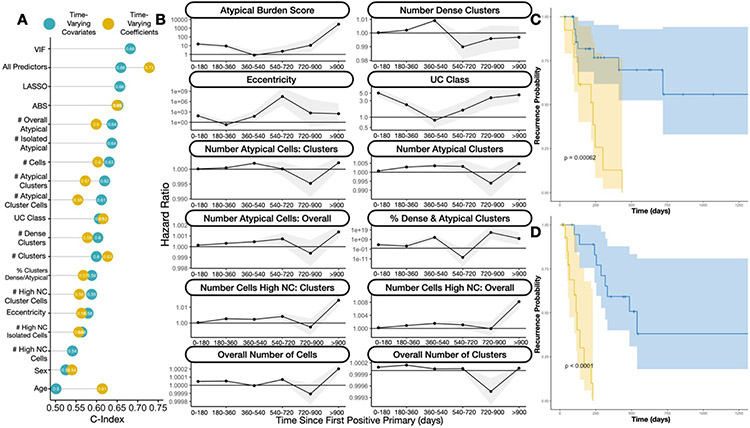
Figure 2: Findings from Recurrence Risk Models:
A) Dot chart indicating concordance statistics for each of the imaging predictors for the time-varying covariate and time-varying effects cox proportional hazards models; UC class stands for category assigned via manual examination by the cytopathologist; VIF and LASSO refer to multivariable models with the respective predictor selection methods; All/Overall predictors refers to multivariable models with all imaging predictors; B) Ribbon plot illustrating hazard ratios and confidence intervals for univariable time-varying effects cox proportional hazards model for individual imaging predictors, demonstrating differing associations with recurrence at distinct time intervals; C) Kaplan-Meier plot and rank-based statistic for fixed imaging predictors collected before or up to the date of the first positive primary, reported for low (blue) and high (yellow) risk patients as assessed using the Cox model; D) similar KM plot for patients with 90 days of follow-up information collected, predicting recurrence risk after this collection period

