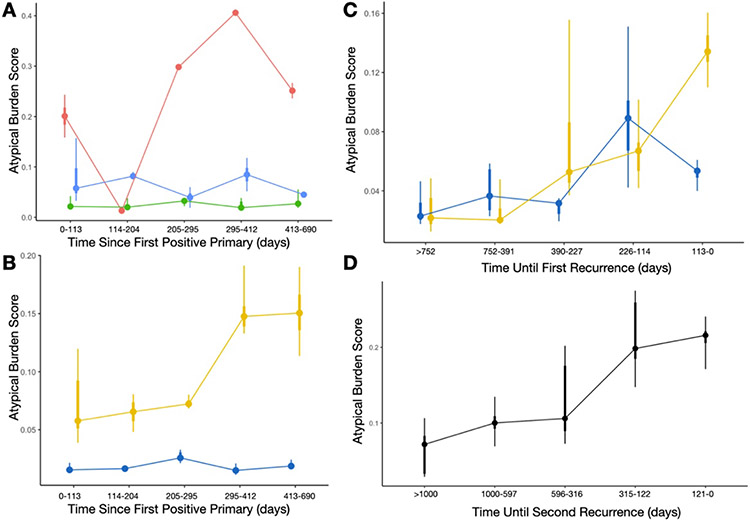
Figure 3: Atypia Burden Scores reported across time, aggregated across distinct time periods using point interval plots:
A) Each curve/color represents ABS scores from patients belonging to three different temporal trajectories (red, blue, green clusters), determined using the time series clustering and summarized using the aggregate statistics for each time period; B) Each curve is colored based on low (blue) and high (yellow) risk patients, measured from the time since first positive primary; C) Comparing ABS scores between low/high risk patients, similar to the previous plot, with cytological exams grouped by days until the first recurrence instead of from the date of the first positive primary; D) ABS scores, combined across distinct time periods, for patients from the first until the second recurrence, grouped by the days until the second recurrence, demonstrating increasing atypia prior to the recurrence finding

