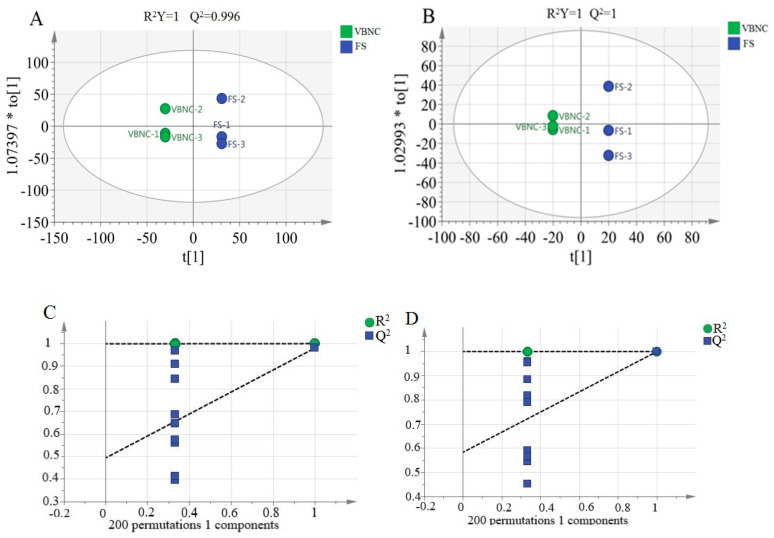
Figure 4.
Orthogonal projections to latent structures discriminant analysis (OPLS-DA) of metabolomics data of viable but nonculturable (VBNC) and recovered Lacticaseibacillus paracasei Zhang (FS). OPLS-DA plots and results of permutation tests (200 random permutations) of metabolomics data generated in the (A,C) positive and (B,D) negative ion modes, respectively. In (A,B), the subfix letter of the sample code represents the specific replicate sample. The two indicators, R2Y and Q2, represent the model interpretation rate and predictive ability, respectively. In (C,D), R2 and Q2 from 200 permutation tests in the OPLS-DA model are plotted. The y-axis shows R2 and Q2, whereas the x-axis shows the correlation coefficient of permuted and observed data. The two points on the right represent the observed R2 and Q2. The cluster of points on the left represents 200 permuted R2 and Q2. Dashed lines denote corresponding fitted regression lines for observed and permutated R2 and Q2.

