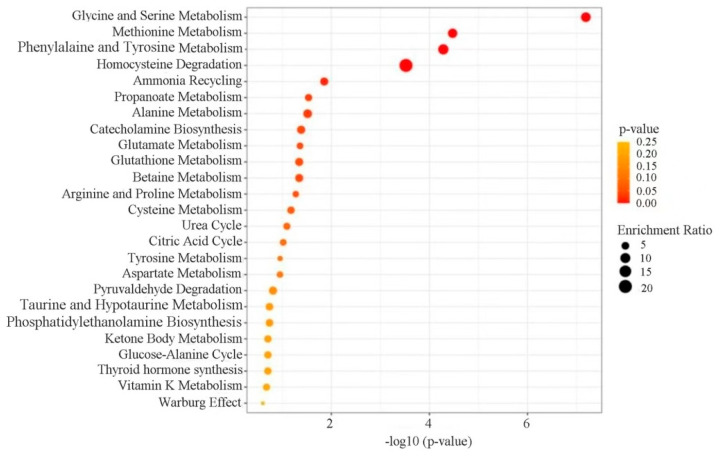
Figure 5.
Metabolic pathway enrichment analysis based on the differential metabolites identified between viable but nonculturable (VBNC) and recovered Lacticaseibacillus paracasei Zhang cells. The size and color of the circles represent the number of differential metabolites in the specifically enriched pathway and its extent of statistical significance, respectively. A darker circle represents a greater magnitude of significant difference.

