Table 5.
Optimization of the sous vide treatment and vinegar soaking for preparing octopus pulpo a La Gallega using RSM.
| Dependent Variables | Values | Sous Vide Treatment Condition | Vinegar Soaking Condition | ||||
|---|---|---|---|---|---|---|---|
| X 1 | X 2 | X 3 | |||||
| Y 1 | Target | 400.0 |
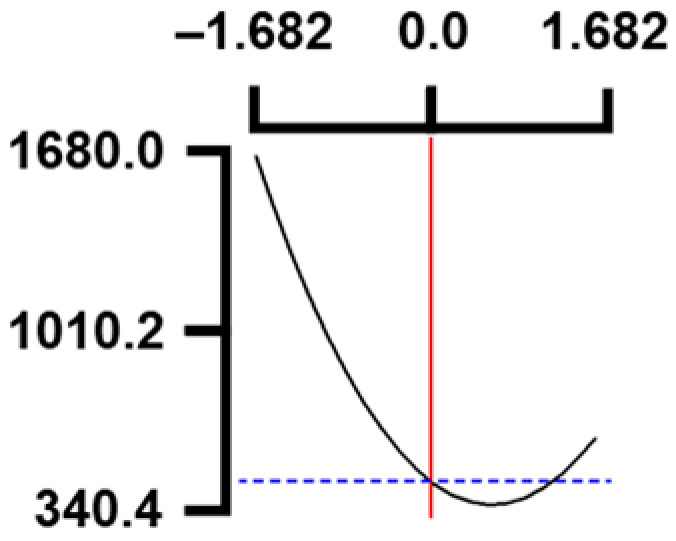
|
400.0 |
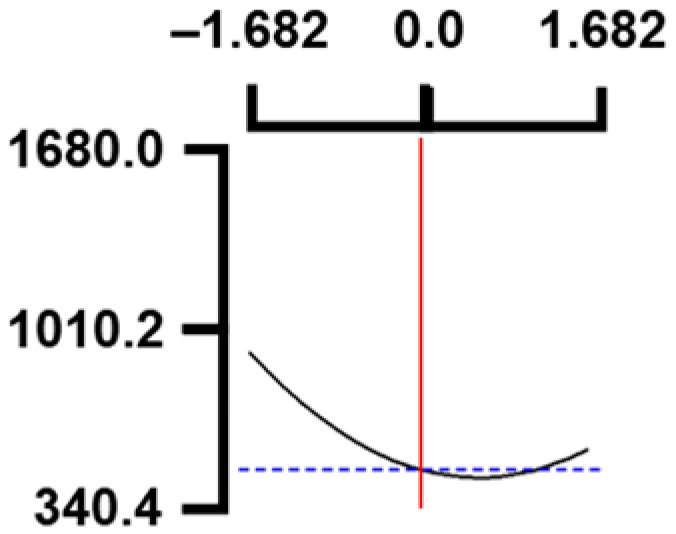
|
400.0 |
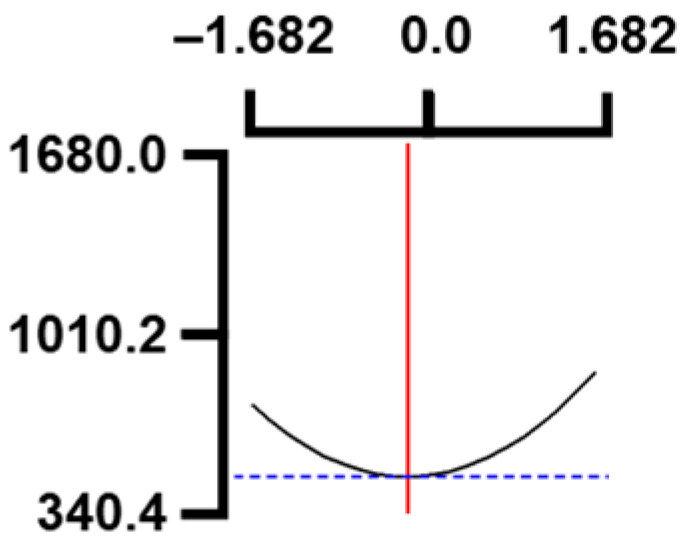
|
| Coded | 0.00 | 0.00 | −0.08 | ||||
| Actual | 85.0 | 85.0 | 0.48 | ||||
| Y 2 | Target | 550.0 |
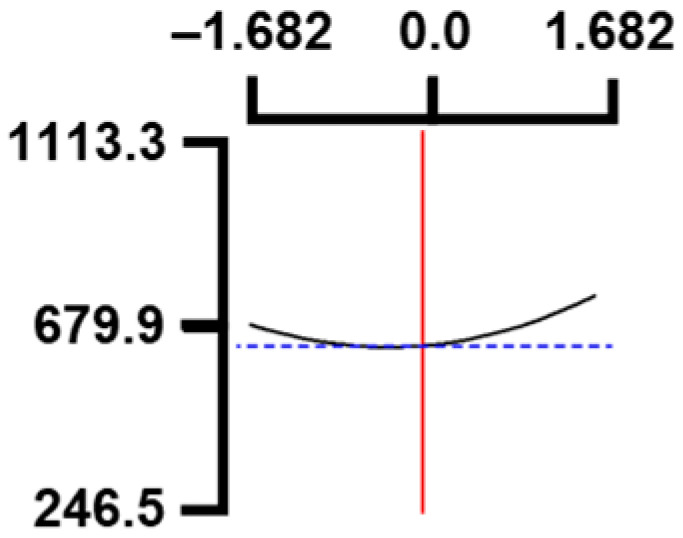
|
550.0 |
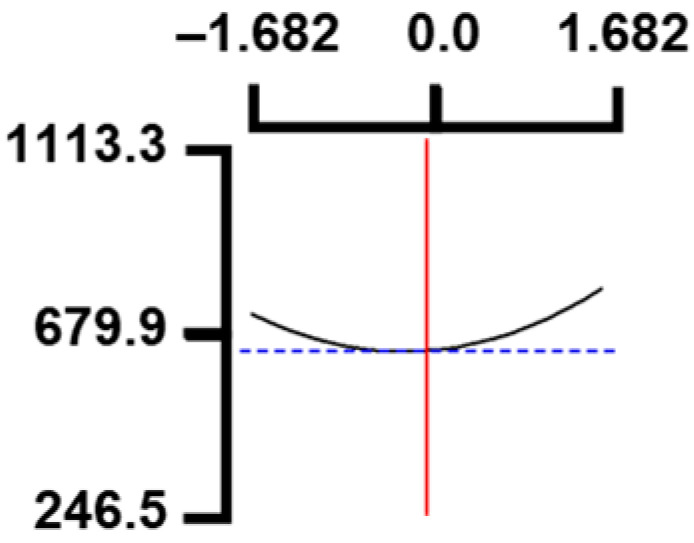
|
550.0 |
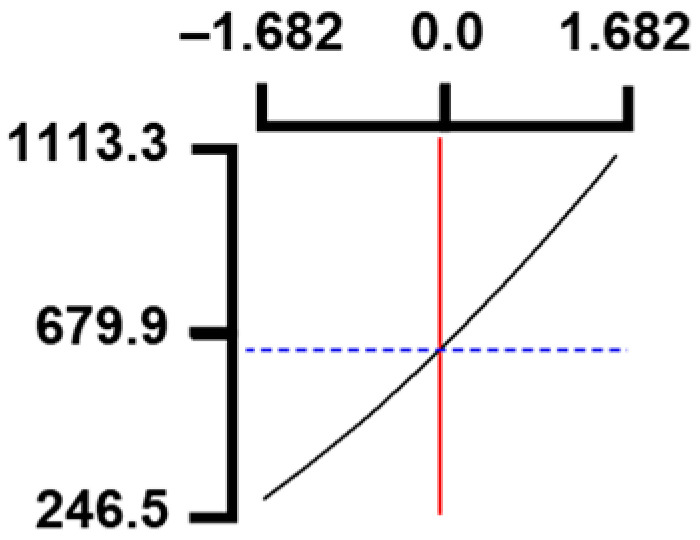
|
| Coded | 0.00 | 0.00 | 0.00 | ||||
| Actual | 85.0 | 85.0 | 0.5 | ||||
| Y 3 | Target | Max. |
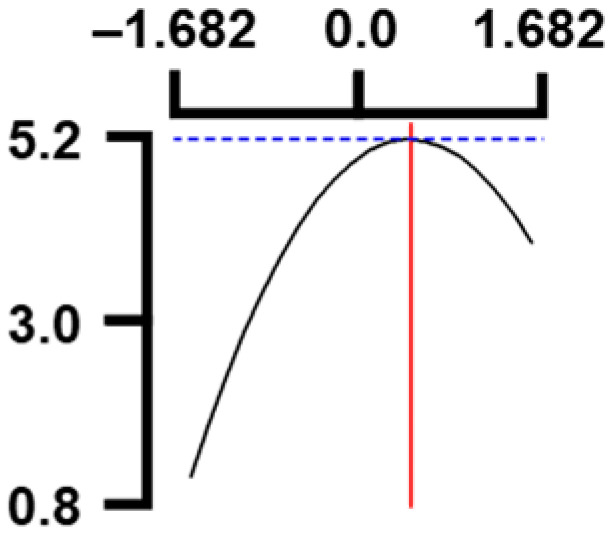
|
Max. |
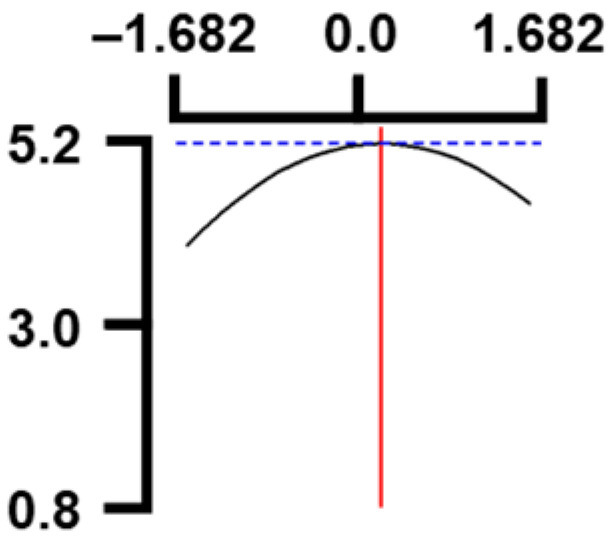
|
Max. |
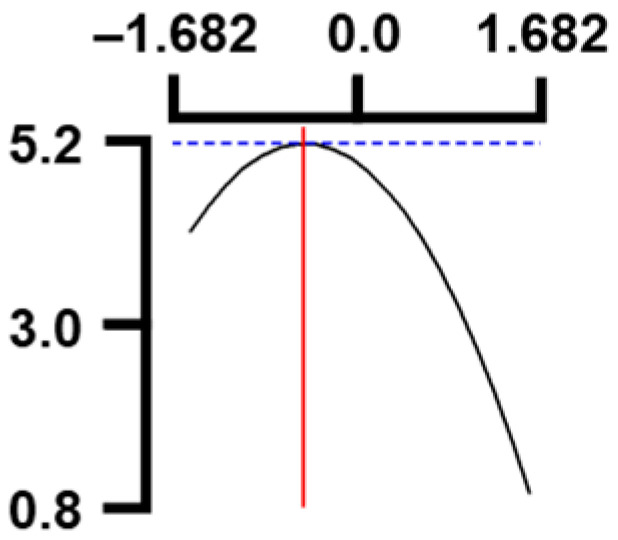
|
| Coded | 0.49 | 0.49 | −0.56 | ||||
| Actual | 89.4 | 89.4 | 0.39 | ||||
| Multiple response optimization | Coded | −0.08 | 0.66 | −0.12 | |||
| Actual | 84.3 | 139.8 | 0.48 | ||||
| Predicted | Y1: 405.0 × 1000 N/m2, Y2: 550.7 mg/100 g, Y3: 4.8 score | ||||||
X1, Sous vide treatment temp. (°C); X2, Sous vide treatment time (min); X3, Vinegar conc. (%); Y1, Hardness (×1000 N/m2); Y2, Total acidity (mg/100 g); Y3, Sensory texture (points).
