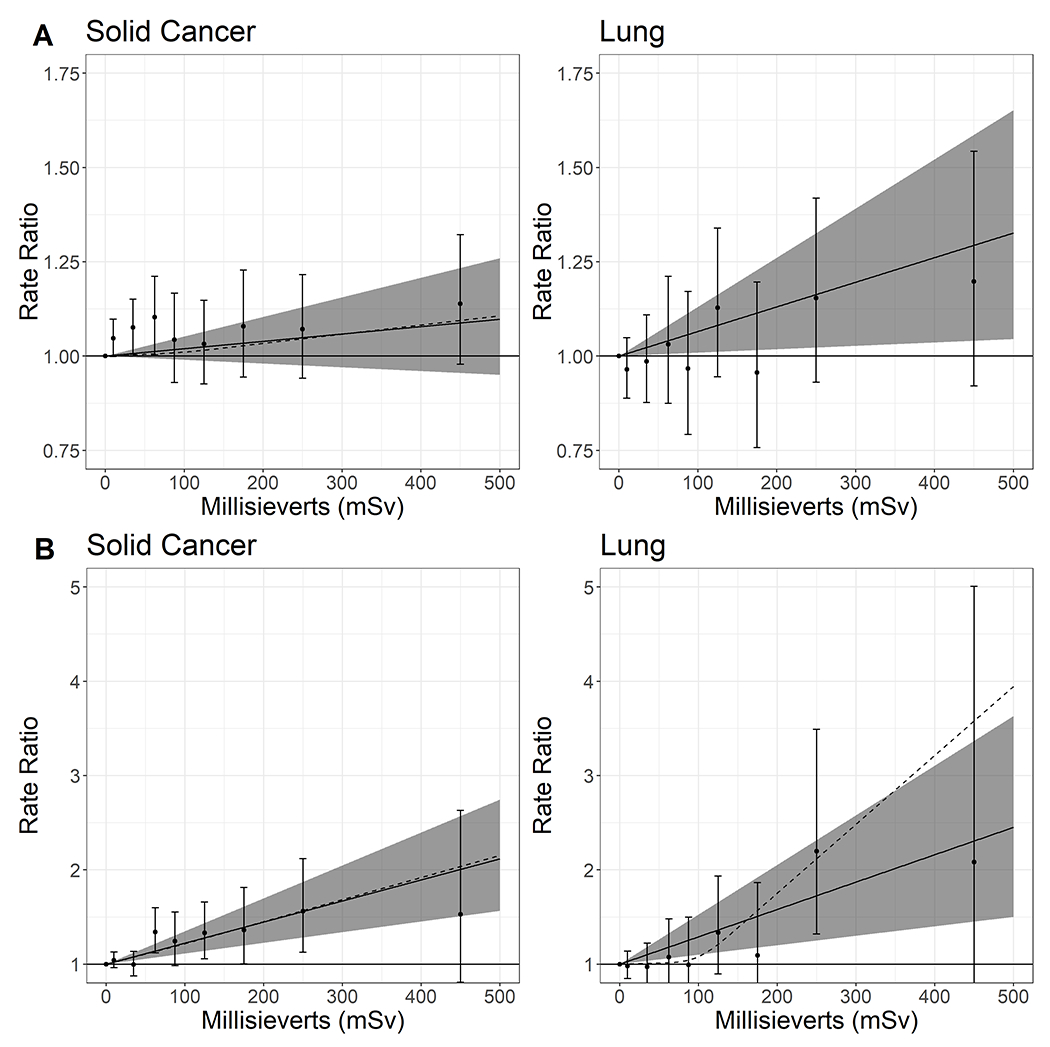
Figure 1.

Relative rate and 95% confidence intervals for all solid cancer deaths and lung cancer deaths among a pooled cohort of workers from five United States nuclear facilities
Panel A includes the full cohort, panel B is restricted to workers first hired in 1960 or later. Solid lines represent the linear relative rates per sievert, and grey areas represent the ranges of the corresponding 95% confidence intervals.
Dotted lines represent the relative rates per sievert using spline models with knots at 50, 100, and 150 mSv.
Points and error bars are relative rates categorized by 0, >0 −20, >20-50, >50-75, >75-100, >100-150, >150-200, >200-300, and >300 mSv.
